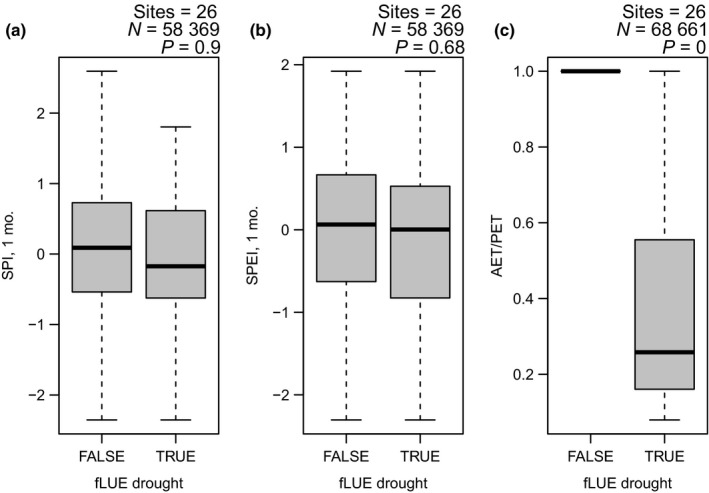
Figure 10.

(a) Standardized precipitation–evapotranspiration index (SPEI, 1 month timescale), (b) standardized precipitation index (SPI, 1 month timescale) and (c) the ratio of actual over potential evapotranspiration (AET/PET) during droughts and non‐drought periods, as identified by the fractional reduction in light use efficiency (fLUE). SPI and SPEI were calculated using the R package ‘spei’ based on monthly total precipitation data from WATCH‐WFDEI (0.5°) (Weedon et al., 2014) extracted at site locations, covering the years 1990–2013, and (for SPEI) potential evapotranspiration based on Thornthwaite (1948). AET/PET was calculated using precipitation measured at FLUXNET and potential and actual evapotranspiration from the SPLASH model (Davis et al., 2017). The box for fLUE = FALSE is collapsed as all AET/PET values in respective days are 1.0. N is the total number of daily data points and P is the P value from an unpaired t‐test. Boxes represent the interquartile range of values (Q 25, Q 75) and whiskers cover Q 25 − 1.5 × (Q 75 − Q 25) to Q 75 + 1.5 × (Q 75 − Q 25).
