Figure 3.
miR9678 Triggers PhasiRNA Biogenesis at the WSGAR Locus.
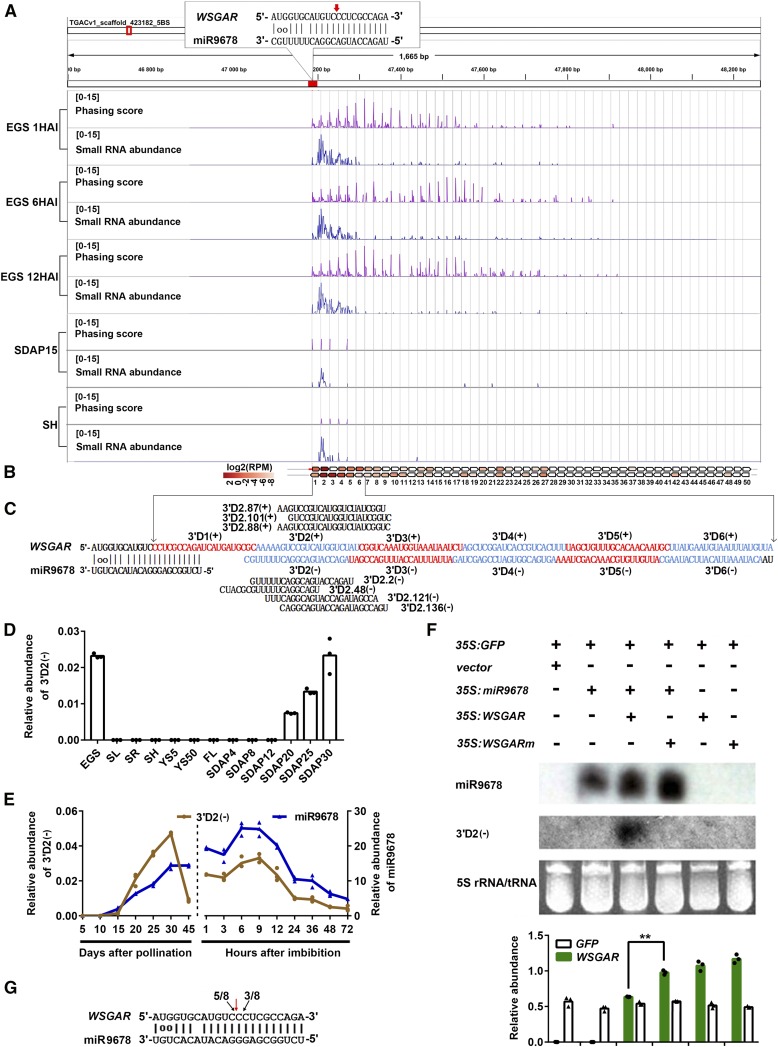
(A) Phasing score and read abundance distribution along WSGAR locus in embryos of germinating seeds (EGS) at 1, 6, and 12 HAI, and shoots (SH) and developing seeds at 15 DAP (SDAP15). Phasing score was calculated based on the mapping results of 21-nucleotide sRNAs following Xia’s method (Xia et al., 2013). Paring of miR9678 and target site is denoted in the top-left corner with the cleavage site marked with a red arrow. Gray gridlines show the 21-nucleotide phasing pattern set up by the miR9678 cleavage site.
(B) The position and expression level of WSGAR-derived phasiRNAs from the first phasing register. Each box represents one phasiRNA generated from the indicated position within WSGAR locus.
(C) Phased pattern of 21-nt siRNAs along WSGAR sequence after the cleavage guided by miR9678. The sense phasiRNAs are designated as 3′D1(+), 3′D2(+), 3′D3(+), etc., while the antisense phasiRNAs are designated in the same way, but with a minus symbol. Some phasiRNA variants produced from the WSGAR plus and minus strands are shown.
(D) Level of phasiRNA 3′D2(-) in various wheat tissues, as in Figure 2D, normalized to the U6 gene. Each bar in the graph corresponds to the mean value of three data points, which are shown by circles.
(E) Comparison of mature miR9678 (blue) and phasiRNA 3′D2(-) (yellow) level in embryos during seed maturation and germination. Data were normalized to the wheat U6 gene. Data are presented as a line connecting the average of three data points (reported as circles and triangles).
(F) Accumulation of miR9678, phasiRNA 3′D2(-), and WSGAR RNA determined in N. benthamiana leaves after transient transformation. The expression levels of miR9678 and phasiRNA 3′D2(-) were measured with RNA gel blotting. The 5S rRNA/tRNA bands were visualized via ethidium bromide staining of polyacrylamide gels, which served as a loading control. The expression level of WSGAR and GFP transcripts measured with RT-qPCR were normalized to the N. benthamiana ACTIN gene. Each bar in the graph corresponds to the mean value of three data points, which are shown as circles or triangles. The double asterisks represent significant differences determined by the Student’s t test at P < 0.01.
(G) Mapping of WSGAR cleavage sites by miR9678 using RLM-5′-RACE in N. benthamiana leaves agroinfiltrated with 35S:miR9678 and 35S:WSGAR. The red arrow represents the predicted cleavage site by miR9678. The black arrows indicate the 5′ ends of the miR9678-guided cleavage products, and numbers (5/8 and 3/8) are the ratios of the cleaved products with respect to total sequenced fragments.

