Figure 4.
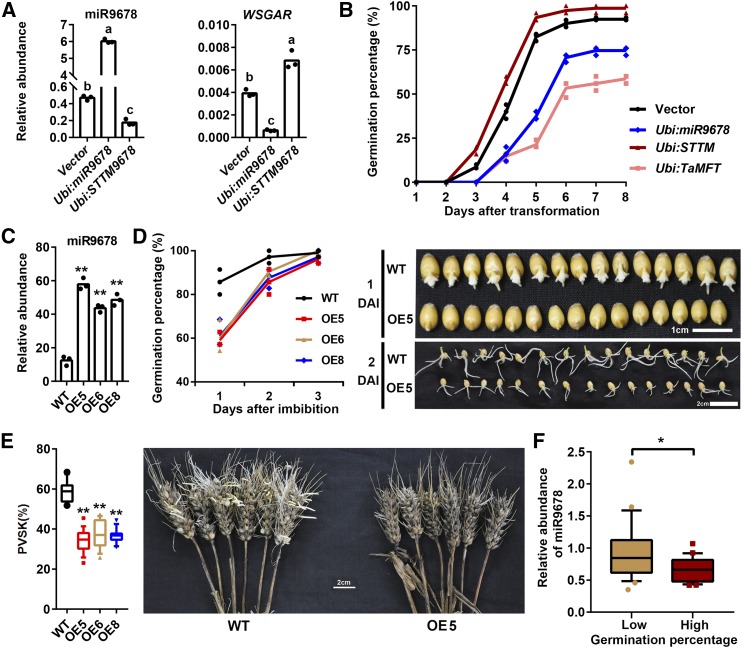
miR9678 Is Negatively Associated with Seed Germination.
(A) Levels of miR9678 and WSGAR mRNA after transient transformation of wheat immature embryos with constructs overexpressing (Ubi:miR9678) or silencing (Ubi:STTM9678) miR9678. The RNA was extracted from immature embryos two days after transformation. Each bar in the graph corresponds to the mean value of three data points, which are shown by circles. Letters above the bar represent significant difference according to a least significant difference or Dunnett’s T3 post-hoc test (where equal variances were not assumed) (P < 0.05).
(B) Time course of the germination percentage after transformation with empty vector (black line), Ubi:miR9678 (blue line), Ubi:STTM9678 (red line), or Ubi:TaMFT (pink line) constructs. Data are represented as a line connecting the average of three data points (reported using different symbols for different samples: circle, triangles, etc.).
(C) Levels of miR9678 in the wild type and three miR9678 OE transgenic wheat lines were tested by RT-qPCR using embryos from germinating seeds at 6 HAI. Each bar in the graph corresponds to the mean value of three data points, which are shown by circles. The double asterisks represent statistically significant differences as determined by the Student’s t test at P < 0.01.
(D) Germination percentage of the wild type and three miR9678 OE transgenic wheat lines. Data are represented as a line connecting the average of three data points (reported using different symbols for different samples: circle, triangles, etc.). Representative pictures of seeds of the wild type and miR9678 OE5 at 1 and 2 DAI are also shown.
(E) Box plots summarize the percentage of visible sprouted kernels (PVSK) from 18 replicates of wild-type and miR9678 OE5, OE6, and OE8 plants. Lines in the box plots indicate the median. The 10th/90th percentiles of outliers are shown. The double asterisks represent significant differences determined by the Student’s t test at P < 0.01. Representative pictures of spikes from the wild type and OE5 are shown. Bar = 2 cm.
(F) Comparison of miR9678 abundance between wheat cultivars with high (≥80%) (n = 22) and low (≤30%) (n = 21) germination percentage at 1 DAI. Lines in the box plots indicate the median. The 10th/90th percentiles of outliers are shown. The single asterisk represents significant differences as determined by Student’s t test at P < 0.05. The expression of miR9678 was analyzed using embryos at 6 HAI and was normalized to the U6 gene.

