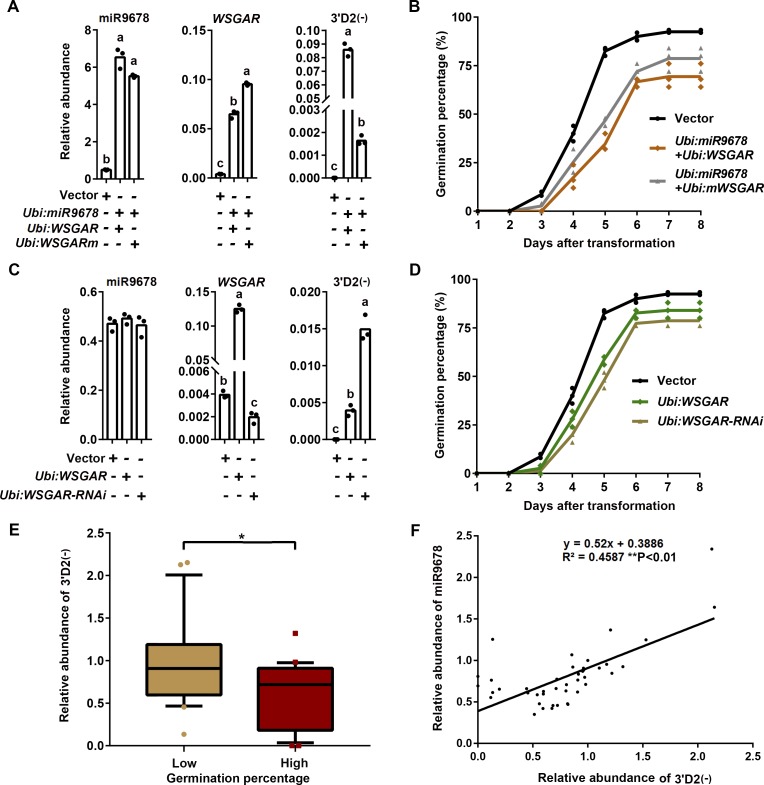
Figure 5.
PhasiRNAs Are Negatively Associated with Seed Germination.
(A) Abundance of miR9678, WSGAR, and 3′D2(-) after Ubi:miR9678 transformation of immature embryos in combination with Ubi:WSGAR or Ubi:WSGARm. The RNA was extracted from immature embryos 2 d after transformation to perform RT-qPCR. Each bar in the graph corresponds to the mean value of three data points, which are shown by circles. Letters above the bar represent significant difference according to a least significant difference or Dunnett’s T3 post-hoc test (where equal variances were not assumed) (P < 0.05).
(B) Time course of the germination percentage after transformation with empty vector (black line), Ubi:miR9678 combined withUbi:WSGAR (orange line), or Ubi:miR9678 combined with Ubi:WSGARm (gray line) constructs. Data are represented as a line connecting the average of three data points (reported using different symbols for different samples: circle, triangles, etc.).
(C) Level of miR9678, WSGAR, and 3′D2(-) after Ubi:WSGAR or Ubi:WSGAR-RNAi transformation of immature embryos. RT-qPCR data are presented as the mean value of three data points, which are shown by circles. Letters above the bar represent significant difference according to a least significant difference or Dunnett’s T3 post-hoc test (where equal variances were not assumed) (P < 0.05).
(D) Time course of changes in percentage germination after transformation with empty vector (black line), Ubi:WSGAR (green line), or Ubi:WSGAR-RNAi (brown line). Data are presented as in (B).
(E) Comparison of 3′D2(-) expression levels between the wheat cultivars with high (≥80%) (n = 22) and low germination percentage (≤30%) (n = 21) used in Figure 4F. The abundance of 3′D2(-) was normalized to the wheat U6 gene. Lines in the box plots indicate the median. The 10th/90th percentiles of outliers are shown. The single asterisk represents significant differences as determined by Student’s t test at P < 0.05.
(F) Correlation of expression levels of miR9678 and 3′D2(-). The expression levels of miR9678 and 3′D2(-) were analyzed using embryos at 6 HAI in 43 wheat cultivarsand were normalized to the wheat U6 gene.

