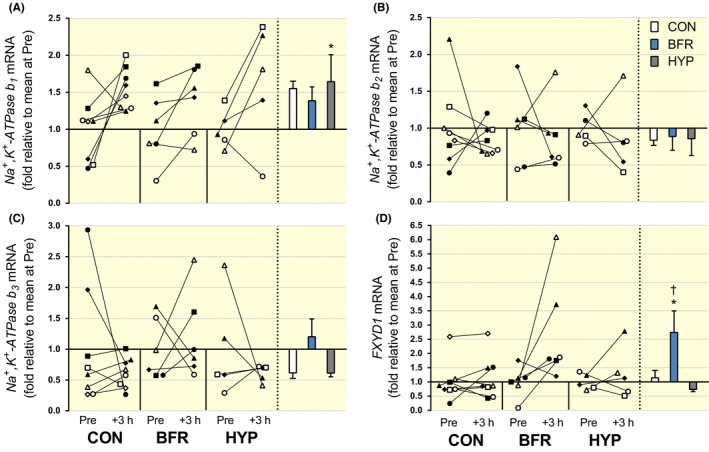
Figure 2.

NKA‐β‐isoform and FXYD1 mRNA responses to moderate‐intensity interval running performed without or with blood flow restriction or in systemic hypoxia. (A) β1, (B) β2, (C) β3 and (D) FXYD1, mRNA content. Individual changes from before (Pre) to 3 hours after exercise (+3 hours) are displayed on the left with each symbol representing one participant across trials and figures. On the right are bars representing mean (±SEM) changes relative to Pre for exercise alone (CON, white; n = 8), with blood flow restriction (BFR, blue; n = 6) or in systemic hypoxia (HYP, grey; n = 5). *P < .05, different from Pre
