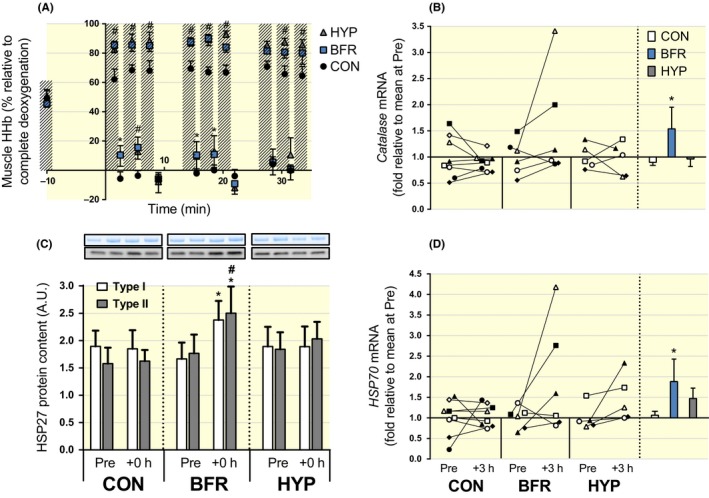
Figure 4.

Changes in muscle hypoxia and indicators of responses to oxidative stress in response to moderate‐intensity interval running performed without or with blood flow restriction or in systemic hypoxia. (A) Muscle hypoxia (ie deoxygenated haemoglobin, Muscle HHb) as assessed by near‐infrared spectroscopy during moderate‐intensity running without (CON, black symbols; n = 8) or with blood flow restriction (BFR, blue symbols; n = 8), or in systemic hypoxia (HYP, grey symbols; n = 8). Hashed bars represent exercise bouts. #P ≤ .05, BFR and HYP different from CON. *P ≤ .05, BFR different from CON. (B) Catalase, and (D) heat‐shock protein 70 (HSP70), mRNA expression. Individual changes from before (Pre) to 3 hours after exercise (+3 hours) are displayed on the left with each symbol representing one participant across trials and figures. On the right are bars representing mean (±SEM) changes relative to Pre for moderate‐intensity running without (CON, white) or with blood flow restriction (BFR, blue), or in systemic hypoxia (HYP, grey). *P ≤ .05, different from Pre. (C) Heat‐shock protein 27 protein content in type I (white bars) and type II fibres (grey bars) at rest before (Pre) and immediately after (+0 hour) exercise. Representative Western blots are indicated above the corresponding bars. *P ≤ .05, increase vs Pre within BFR. #P ≤ .05, BFR different from CON within fibre type. Data are means ± SEM
