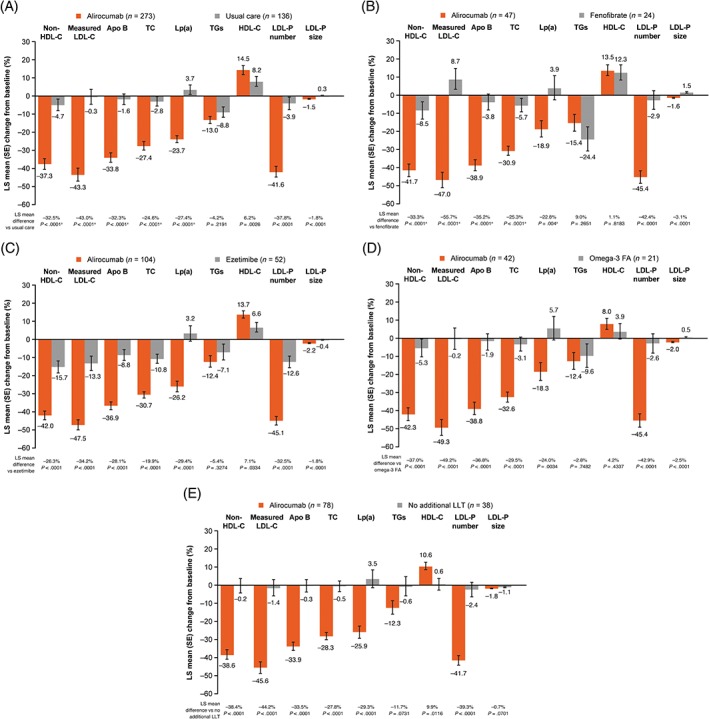
Figure 2.

Primary and selected key secondary efficacy endpoints at week 24 for A, the overall study population; B, fenofibrate; C, ezetimibe; D, omega‐3 fatty acids and E, no lipid‐lowering therapy (ITT analysis). Abbreviations: Apo, apolipoprotein; FA, fatty acids; HDL‐C, HDL cholesterol; ITT, intenttion‐to‐treat; LDL‐C, LDL cholesterol; LDL‐P, LDL particle; LLT, lipid‐lowering therapy; Lp(a), lipoprotein (a); LS, least‐squares; TC, total cholesterol; TG, triglyceride. aStatistically significant according to the fixed hierarchical approach used to ensure a strong control of the overall type I error rate at the 0.025 level. ITT analysis includes individuals according to planned treatment (see footnote to Figure 1)
