
Figure 2.
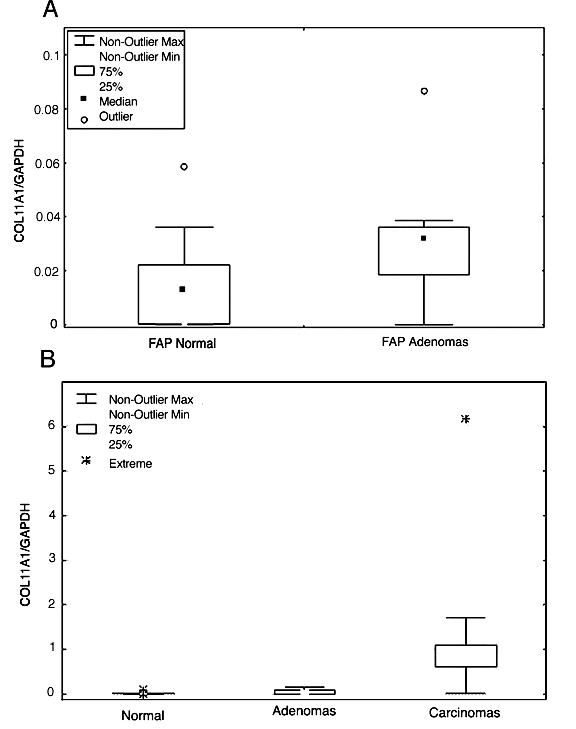
Box Plots illustrating the difference between expression of COL11A1 showing FAP normal tissue samples compared to FAP polyps (2a), and FAP polyps compared to sporadic colorectal carcinomas (2b). The boxes mark the interval between the 25th and 75th percentiles. The whiskers denote the interval between the 10th and 90th percentiles. An observation that lies more than 1.5 times the height of a box from the box is defined as outliner and when an observation lies more than 3 times the height of a box from the box, it is defined as an extreme value.