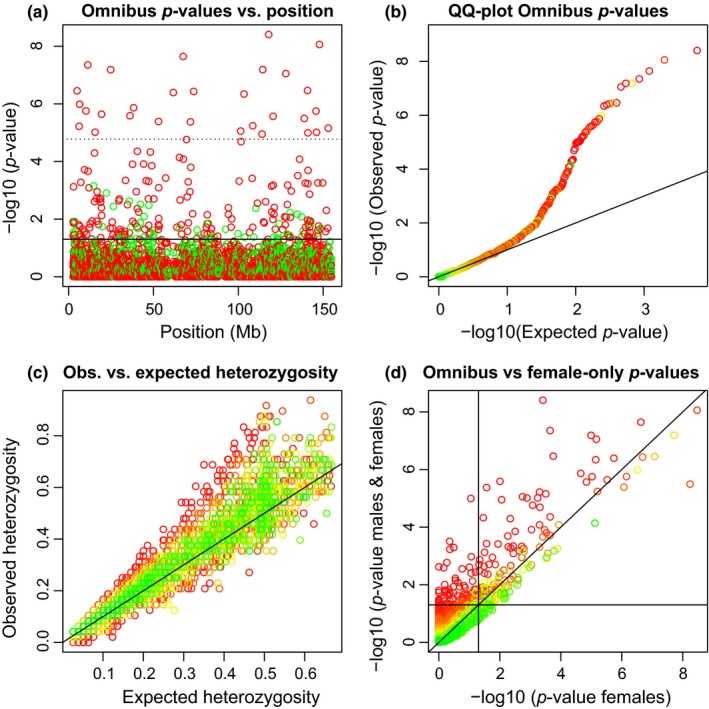
Figure 1.

Hardy–Weinberg equilibrium tests for 2,979 tri‐allelic X‐chromosomal variants. (a): p‐values of the omnibus exact test (HWP & EAF) vs. variant position. The solid horizontal line corresponds to α = 0.05, and the dotted horizontal line corresponds to the Bonferroni‐corrected threshold. Variants colour‐coded according to having excess of heterozygotes (red) or lack of heterozygotes (green) with respect to HWP. (b) QQ‐plot of the omnibus exact p‐values. (c) Observed vs. expected heterozygosity. (d) Omnibus exact p‐values vs. exact p‐values obtained in a test using the females only. Horizontal and vertical lines correspond to α = 0.05. Panels b, c and d show variants colour‐coded according to the p‐value of an exact test for EAF
