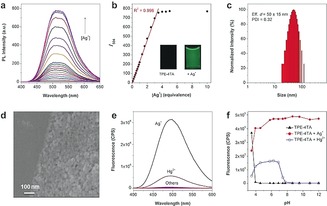
Figure 2.

Characterization of the fluorogenic aggregation process. a) Fluorescence of TPE‐4TA (5 μm) by stepwise addition of Ag+ in deionized water; b) Plot of intensity at 504 nm in (a) as a function of [Ag+]/[TPE‐4TA]. c) DLS and d) SEM characterization of the fluorescent solution. e) Fluorescence of TPE‐4TA (5 μm) mixed with metal ions (20 μm, including Na+, K+, Ca2+, Mg2+, Mn2+, Zn2+, Cu2+, Fe2+ Fe3+, Ni2+, Au+, Pb2+, Cd2+, Pd2+, and Co2+) in phosphate aqueous solution (pH 7.4). f) Fluorescence of TPE‐4TA (10 μm) at 504 nm against the pH values of the phosphate aqueous solution in the absence or presence of Ag+ or Hg2+ (10 equiv) respectively. λex=368 nm.
