
Figure 2.
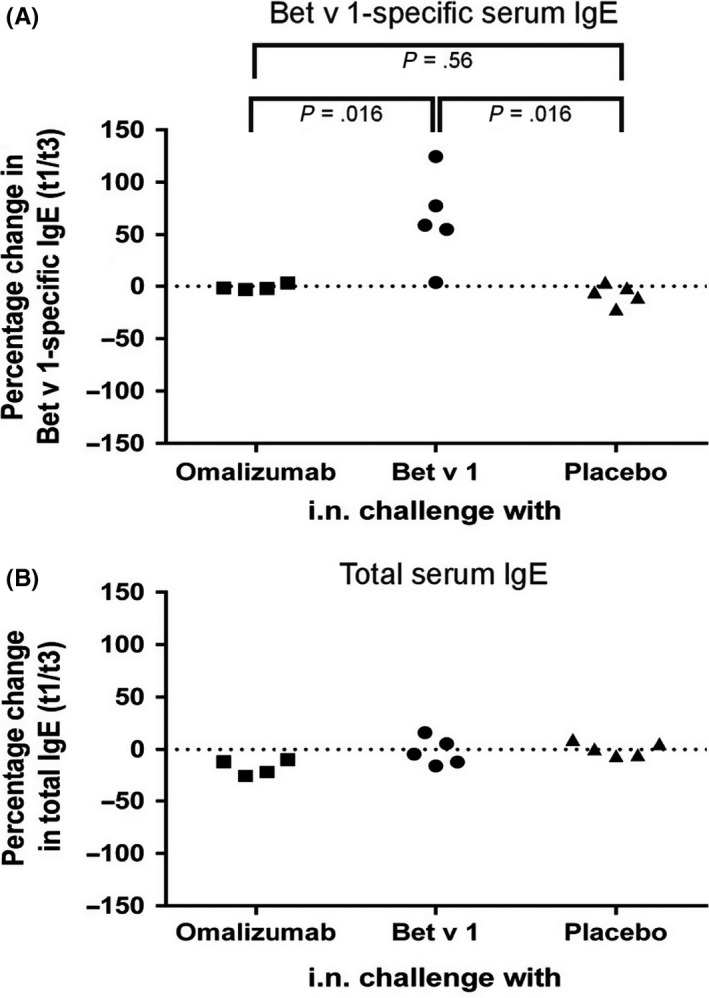
Percentage change in total and Bet v 1‐specific serum IgE levels following intranasal challenge with omalizumab, Bet v 1 or placebo. Percentage changes (y‐axes) of (A) Bet v 1‐specific and (B) total IgE levels between t1 (before challenge) and t3 (day 35 ± 4 days after challenge) are shown for each subject. Significant differences between the treatment groups were observed only for Bet v 1‐specific IgE (Kruskal‐Wallis test: P = .0053) levels but not for total IgE levels (Kruskal‐Wallis test: P = .0521). Pairwise comparisons using the two‐sided Wilcoxon rank‐sum test were therefore only performed for Bet v 1‐specific IgE levels and P values are indicated