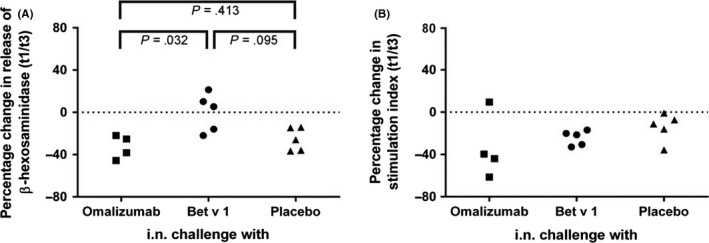
Figure 3.

Effects of changes of allergen‐specific IgE levels on basophil activation. (A) Rat basophilic leukaemia (RBL) cells expressing human FcεRI were loaded with sera obtained at t1 and t3 and then stimulated with Bet v 1. Percentage changes (y‐axes) of β‐hexosaminidase release between t3 and t1 are shown. (B) Peripheral mononuclear cells (PBMCs) from subjects challenged intranasally (x‐axis: omalizumab, Bet v 1 or placebo) were stimulated with Bet v 1. Differences in the stimulation indices for the upregulation of CD203c between t3 and t1 are shown as percentage changes (y‐axes). Significant differences between the 3 treatment groups were observed for the RBL assay (Kruskal‐Wallis test: P = .0463) shown in (A) but not for the assays using basophils directly collected from subjects (Kruskal‐Wallis test: P = .1934) shown in (B). Pairwise comparisons using the two‐sided Wilcoxon rank‐sum test were therefore only performed for the RBL assay and P‐values are indicated
