Figure 4.

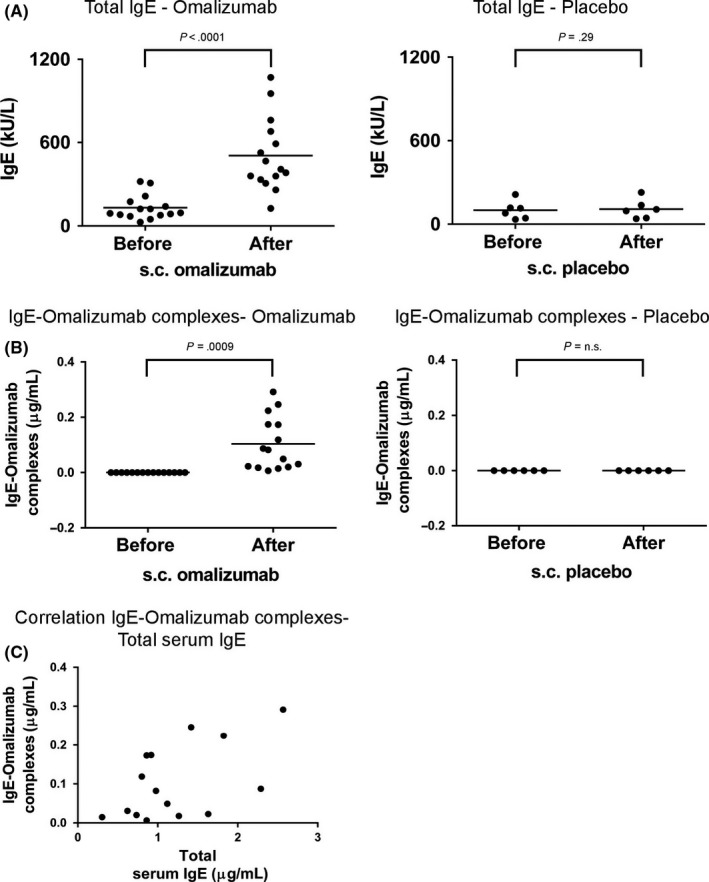
Total serum IgE and IgE‐omalizumab complex levels in subjects after subcutaneous omalizumab administration. (A) Total serum IgE levels (y‐axis: kU/L) and (B) levels of IgE‐omalizumab complexes (y‐axis: μg/mL) in subjects before and after subcutaneous administration of omalizumab (left, n = 16) or placebo (right, n = 6). Sera “Before s.c. administration” were obtained at visit V1 (V1: screening visit, at least 2 weeks before visit V2 where first dose of omalizumab was administered) except for subject S9 where serum was obtained at V2. Sera “After s.c. administration” were obtained at visit V8 (12 weeks after first subcutaneous administration) except for subject S18 where serum obtained at visit V6 (8 weeks after first subcutaneous administration) and for subject S16 where serum was obtained at visit V10 (16 weeks after first subcutaneous administration). (C) Correlation of total IgE levels (x‐axis) with IgE‐omalizumab complexes (y‐axis) is displayed for patients after subcutaneous omalizumab administration. Significant results (P‐values) are indicated
