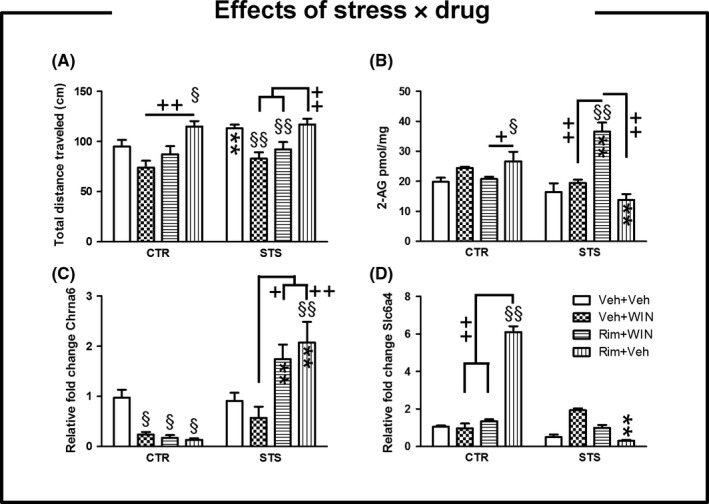
Figure 3.

Effects of repeated exposure to psychosocial stress following acute cannabinoid drugs administration. Data are expressed as mean ± SEM. (1) Effects on mice behavior: In an open‐field arena, exposure to psychosocial stress exacerbated general motor activity following vehicle administration (panel A‐B). However, psychosocially stressed mice exposed to the agonist WIN alone traveled smaller distances than the vehicle group (P < 0.01) (panel A). The administration of inverse agonist Rim in controls enhanced the total distance traveled when compared to vehicle (P < 0.05) (panel A). (2) Effects on endocannabinoids levels: Controls treated with Rim alone underwent an increase in 2‐AG levels when compared to either vehicle or Rim+WIN‐treated mice (P < 0.05, in the PFC) (panel B). The administration of the inverse agonist Rim by the end of stress period reduced the levels of the endocannabinoid 2‐AG when compared to controls that received the same drug treatment (P < 0.01, in the PFC) (panel B). (3) Effects on gene expression: The use of synthetic cannabinoid drugs decreased the expression of Chrna6 in controls (P < 0.05, in the PFC) (panel C) and also did but not significantly when WIN was administered upon stress exposure while the inverse agonist Rim clearly antagonized such effects (P < 0.01, in the PFC) (panel C). Social defeat animals cotreated with Rim+WIN or treated with Rim alone underwent a remarkable upregulation of Chrna6 expression when compared to their nonstressed counterparts (P < 0.01, in the PFC) (panel C). We assessed a higher transcription rate for Slc6a4 gene in controls upon injection with the inverse agonist in comparison with the remaining control groups (P < 0.01, in the PFC) and also when this drug was administered in stressed animals (P < 0.01, in the PFC) (panel D). The remaining comparisons are depicted in the graph. An * indicates significant differences between stress groups and their respective control group. Control or stress intragroup comparisons between vehicle and treated mice are indicated by an §. Otherwise underlined + indicated intragroup comparisons between treatment groups in control or stress conditions. One or two symbols indicate P < 0.05; P < 0.01, respectively. N = 15 for behavioral testing, n = 4 for endocannabinoids quantification; n = 5 for whole‐genome gene expression. PFC, prefrontal cortex; CTR, control; STS, stress
