
Figure 1.
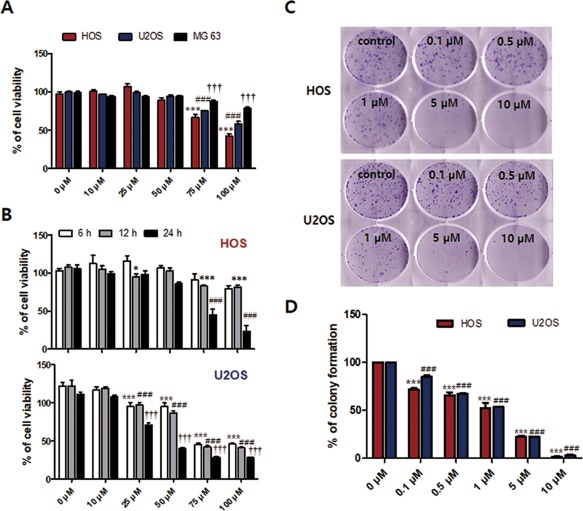
Delphinidin reduced cell viability and cell proliferation in OS cell lines. (A) OS cell lines (HOS, U2OS, and MG‐63) were treated with delphinidin (0–100 μM) for 24 h and measured using the MTT assay. The data are expressed as the mean ± SEM (n = 6). The statistical significance of each group was analyzed by a one‐way ANOVA and Dunnett test [***P < 0.001 at HOS, ###P < 0.001 at U2OS, and †††P < 0.001 at MG63 for 24 h compared to the non‐treated group (0 μM)]. (B) HOS and U2OS cells were treated with 0–100 µM of delphinidin for 6–24 h (*P < 0.05, ***P < 0.001 at 12 h and ###P < 0.001 at 24 h compared to the non‐treated group (0 μM) in HOS cell; ***P < 0.001 at 6 h, ###P < 0.001 at 12 h and †††P < 0.001 at 24 h compared to the non‐treated group (0 μM) in U2OS cell). (C) HOS and U2OS cells were treated with various concentrations (0.1–10 µM) of delphinidin for 7 days, and were observed using a colony‐forming assay. (D) Quantification of the colony number described in C The data are expressed as the mean ± SEM (n = 3) [***P < 0.001 at HOS and ###P < 0.001 at U2OS for 7 days compared to the control group (0 μM)] [Color figure can be viewed at http://wileyonlinelibrary.com]