
Figure 2.
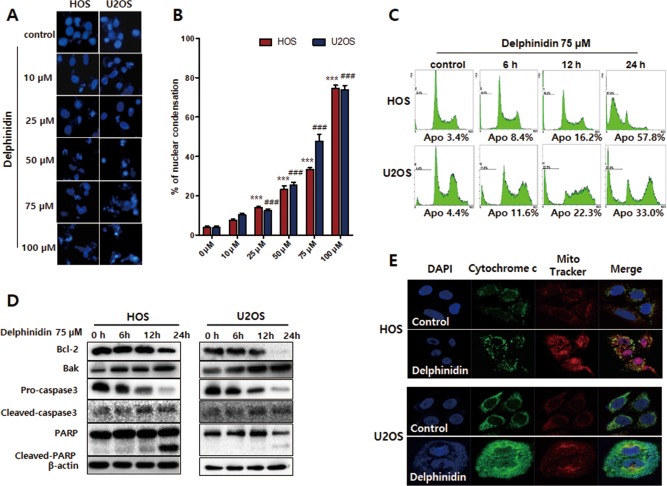
Delphinidin induced morphological changes and apoptosis through the mitochondrial‐mediated pathway in HOS and U2OS cells. (A) Apoptotic nuclei manifested condensed and fragmented DNA, brightly stained by Hoechst staining. (B) The percentage of apoptosis cells was calculated and shown in histograms. The data are expressed as the mean ± SEM (n = 3). (***P < 0.001 at HOS and ###P < 0.001 at U2OS) (C) The apoptosis ratio of HOS and U2OS was measured using flow cytometry. (D) HOS and U2OS cells were treated with 75 µM delphinidin for 6–24 h and then examined using a western blot analysis. (E) Emission of the cytochrome c from the mitochondria into the cytosol was analyzed with a confocal microscope [Color figure can be viewed at http://wileyonlinelibrary.com]