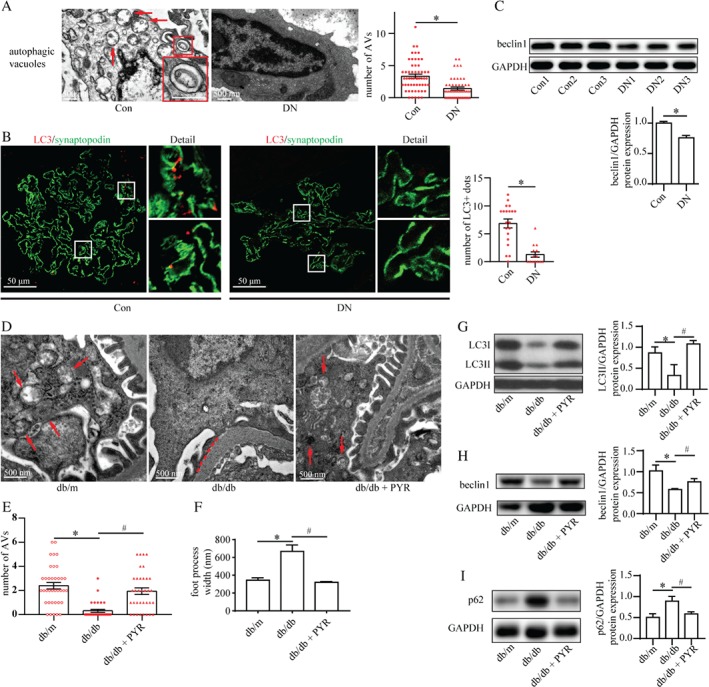
Figure 1.

Autophagic insufficiency in podocytes under high AGE conditions. (A) TEM of kidney specimens from control subjects (normal renal tissues from patients with renal cell carcinoma) and patients with diabetic nephropathy (DN). The number of autophagic vacuoles (AVs; arrows) was reduced in podocytes from patients with DN (means ± SEM, n = 4 for control subjects, n = 5 for patients with DN; 51–57 images were selected from each group). Student's t‐test; *p < 0.05 versus control group. Scale bar = 500 nm. (B) Immunofluorescence staining for LC3 (red) and synaptopodin (green) in the renal cortex from control subjects and patients with DN. Quantification of the number of LC3‐positive dots (yellow) indicated a reduction in the number of autophagosomes in podocytes from patients with DN (means ± SEM, n = 3; 14–20 images from each group). Student's t‐test; *p < 0.05 versus control. Scale bar = 50 μm. (C) Western blot assay of beclin1 expression in the renal cortex from control subjects and patients with DN. Beclin1 expression normalized against GAPDH was reduced in the renal cortex from patients with DN (means ± SEM, n = 3). Student's t‐test; *p < 0.05 versus control. (D–F) TEM of the renal cortex from db/m mice treated with vehicle (db/m, representing non‐diabetic control), db/db mice treated with vehicle (db/db, representing diabetic mice with a high AGE level), and db/db mice treated with PYR (db/db + PYR, representing diabetic mice with a normal AGE level). PYR recovered the reduced number of AVs in podocytes from db/db mice (E) (means ± SEM, n = 4; 32–36 images from each group). An increased width of podocyte foot processes (dashed line) in db/db mice was prevented by PYR treatment (F) (means ± SEM, n = 4; 32–36 images from each group). Two‐way ANOVA, followed by post hoc Student–Newman–Keuls test; *p < 0.05 versus db/m mice; # p < 0.05 versus db/db mice. Scale bar = 500 nm. (G–I) Western blots for expression of LC3II (G), beclin1 (H), and p62 (I) from the renal cortex in db/m, db/db, and db/db + PYR mice. Downregulation of the expression of LC3II and beclin1 accompanied by upregulation of p62 expression indicated the inhibition of autophagic flux in db/db mice, which was restored by PYR treatment (means ± SEM, n = 4). Two‐way ANOVA, followed by post hoc Student–Newman–Keuls test; *p < 0.05 versus db/m mice; # p < 0.05 versus db/db mice.
