Figure 4.

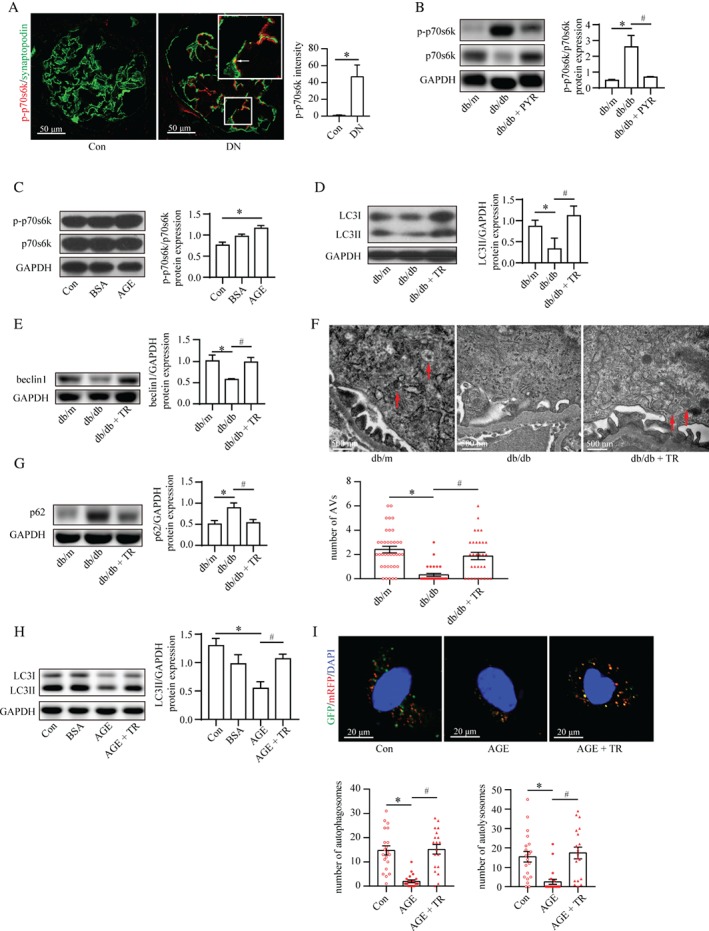
mTOR activation mediates AGE‐stimulated autophagy impairment. (A) Immunofluorescence staining for phospho‐p70s6k (p‐p70s6k, a marker of mTOR activity; red) and synaptopodin (green) from controls and patients with DN. The p‐p70s6k expression in podocytes (arrows) was enhanced in patients with DN (mean ± SEM, n = 3; 12 images from each group). Student's t‐test; *p < 0.05 versus control group. Scale bar = 50 μm. (B) The ratio of p‐p70s6k to p70s6k was increased in db/db mice compared with control, indicating mTOR hyperactivation, by western blotting, which was recovered to normal levels by PYR (mean ± SEM, n = 4). Two‐way ANOVA, followed by post hoc Student–Newman–Keuls test; *p < 0.05 versus db/m mice; # p < 0.05 versus db/db mice. (C) The same pattern of mTOR activity was observed in AGE‐stimulated podocytes (mean ± SEM, n = 3). One‐way ANOVA, followed by post hoc Student–Newman–Keuls test; *p < 0.05 versus control. (D, E) Torin1 restored the attenuated level of LC3II (D) and beclin1 (E) in db/db mice according to western blotting (mean ± SEM, n = 3–4). Two‐way ANOVA, followed by post hoc Student–Newman–Keuls test; *p < 0.05 versus db/m mice; # p < 0.05 versus db/db mice. (F) TEM showed that Torin1 recovered the reduced number of autophagic vacuoles (AVs) in podocytes from db/db mice (mean ± SEM, n = 4; 31–37 images from each group). Two‐way ANOVA, followed by post hoc Student–Newman–Keuls test; *p < 0.05 versus db/m mice; # p < 0.05 versus db/db mice. Scale bar = 500 nm. (G) Torin1 reduced the p62 level in db/db mice by western blotting (mean ± SEM, n = 4). Two‐way ANOVA, followed by post hoc Student–Newman–Keuls test; *p < 0.05 versus db/m mice; # p < 0.05 versus db/db mice. (H) Torin1 restored the reduction of LC3II expression in AGE‐stimulated podocytes by western blotting (mean ± SEM, n = 3). One‐way ANOVA, followed by post hoc Student–Newman–Keuls test; *p < 0.05 versus control; # p < 0.05 versus AGE. (I) Confocal laser scanning microscopy images of podocytes transfected with the tandem GFP‐mRFP‐LC3 adenovirus. Torin1 recovered the reduced number of autophagosomes (yellow) and autolysosomes (red) in AGE‐stimulated podocytes (mean ± SEM, n = 3; 19–21 cells from each group). One‐way ANOVA, followed by post hoc Student–Newman–Keuls test; *p < 0.05 versus control; # p < 0.05 versus AGE. Scale bar = 20 μm.
