
Figure 5.
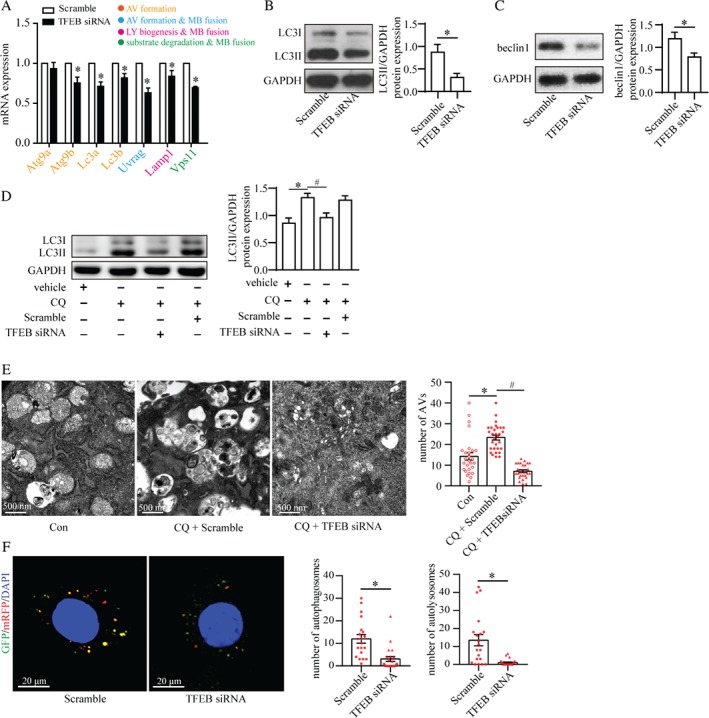
Role of TFEB in autophagic flux in podocytes. (A) Reverse transcription–quantitative PCR (RT‐qPCR) analyses of the expression of TFEB target genes in podocytes treated with scrambled siRNA (Scramble) or TFEB siRNA. The colors represent the functions of genes in regulating autophagy as indicated. TFEB siRNA reduced the mRNA expression of the genes involved in the formation and turnover of autophagosomes (mean ± SEM, n = 3). Student's t‐test; *p < 0.05 versus scrambled siRNA. AV: autophagic vacuoles; MB: membrane; LY: lysosome. (B, C) TFEB siRNA decreased the level of LC3II (B) and beclin1 (C) according to western blotting (mean ± SEM, n = 3). Student's t‐test; *p < 0.05 versus scrambled siRNA. (D) TFEB siRNA reduced chloroquine (CQ)‐induced LC3II accumulation, suggesting the importance of TFEB in autophagosome formation (mean ± SEM, n = 3). One‐way ANOVA, followed by post hoc Student–Newman–Keuls test; *p < 0.05 versus vehicle; # p < 0.05 versus CQ. (E) TEM revealed that the number of accumulated autophagic vacuoles (AVs) in CQ‐stimulated podocytes was reduced by TFEB siRNA (mean ± SEM, n = 3; 26–30 images from each group). One‐way ANOVA, followed by post hoc Student–Newman–Keuls test; *p < 0.05 versus control; # p < 0.05 versus CQ + scrambled siRNA. Scale bar = 500 nm. (F) Confocal laser scanning microscopy of podocytes transfected with the tandem GFP‐mRFP‐LC3 adenovirus. TFEB siRNA reduced the number of autophagosomes (yellow) and autolysosomes (red) (mean ± SEM, n = 3; 20–22 cells from each group). Student's t‐test; *p < 0.05 versus scrambled siRNA. Scale bar = 20 μm.