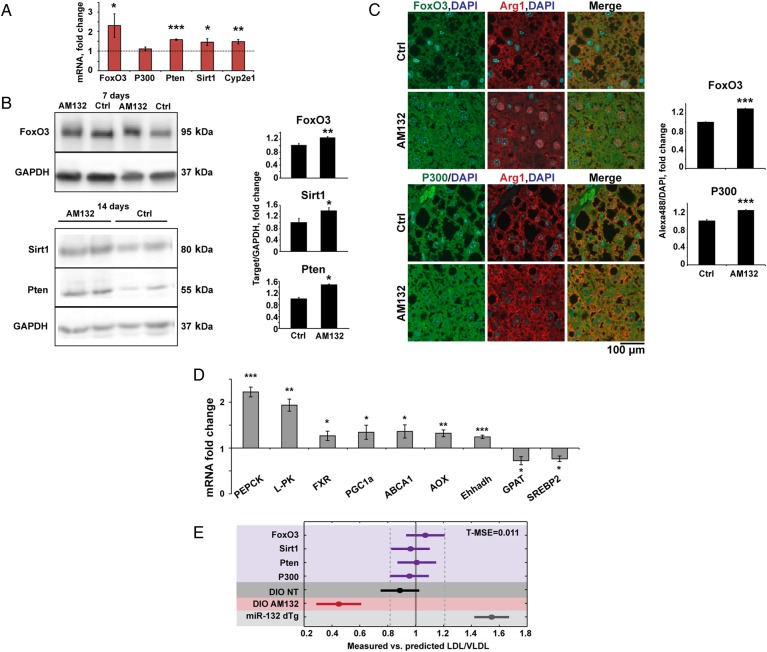
Figure 6.
miR-132 suppression upregulates its liver targets. (A) Elevated liver miR-132 target transcripts in AM132-treated diet-induced obese mice (DIO) mice, 7 days post-treatment, determined by Fluidigm quantitative PCR and normalised to multiple housekeeping genes and then to control (Ctrl) treatment (n=4). (B) Western blot and quantification of elevated liver FoxO3, Sirt1 and Pten in AM132-treated DIO mice, 7 and 14 days post-treatment. (C) Immunofluorescence and quantification of elevated FoxO3 and P300 in liver sections. Arginase 1 (Arg1) served as a hepatocyte marker (n=3–4) and quantification was performed in areas that did not contain fat vacuoles. (D) Increased and reduced metabolic transcripts in AM132-treated DIO mice 7 days post-treatment (n=4). (E) The ratio of measured versus predicted serum low-density lipoprotein/very low-density lipoprotein (LDL/VLDL) values was calculated with a partial least squares regression (PLS-R) linear model in the five different in vivo experiments (GapmeRs, purple; DIO non-treated (NT), dark grey; DIO treated with AM132, red; miR-132 dTg, light grey). Elevating (dTg) or lowering (AM132 treated) miR-132 leads to serum LDL/VLDL levels that are higher or lower, respectively, than when reducing levels of a single miR-132 targets. Mean square error for training groups (T-MSE) was calculated according to GapmeR knockdown in vivo experiments. p<0.01 (Bonferroni post hoc). Data represent three experiments, *p<0.05, **p<0.01, ***p<0.001 (two-tailed Student's t-test). Values shown are mean±SEM.

