Figure 1.
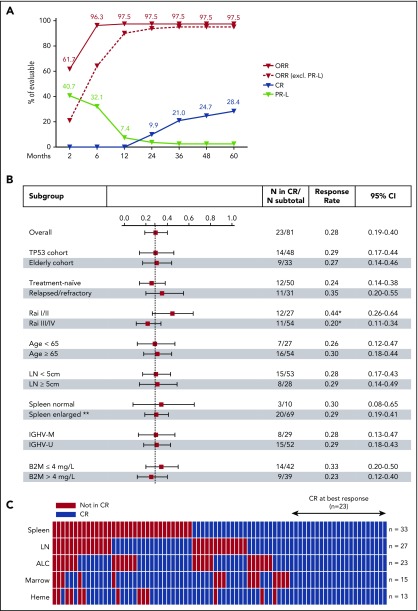
Complete response on ibrutinib. (A) Cumulative best response in 81 evaluable patients. (B) Forest plot showing CR rates at best response in subgroups divided by clinical and laboratory criteria; the dashed line marks the CR rate in all patients (23.5%). Whiskers indicate 95% CI. *Trend in CR rate difference between low and advanced Rai stages (P = .054). **Spleen size was not evaluated in 2 patients with history of splenectomy. (C) Status of CR criteria in 79 patients; spleen (volume assessed by CT), target lymph nodes (LN), absolute lymphocyte count (ALC), bone marrow infiltration and cellularity (Marrow), and hematologic recovery (Heme). Twenty-three (28%) patients met all CR criteria (blue blocks); red blocks mark CR criteria not met. B2M, β2-microglobulin; IGHV-M, IGHV mutated; IGHV-U, IGHV unmutated.

