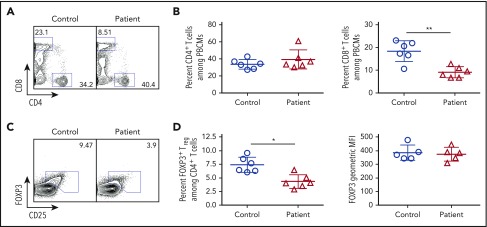
Figure 3.
Flow cytometric analysis of peripheral blood lymphocyte populations in patients with CD3G mutations. (A) Representative flow cytometry plots for circulating CD4+ and CD8+ T lymphocytes in controls and CD3G-mutated patients. (B) Percentage of CD4+ (left) and CD8+ (right) T cells among PBMCs for control and CD3G-mutated patients. (C). Representative flow cytometry for Treg identification by FOXP3 and CD25 expression. (D) Percentage (left) of FOXP3+ Treg cells and FOXP3 mean fluorescence intensity (right) for controls and patients.

