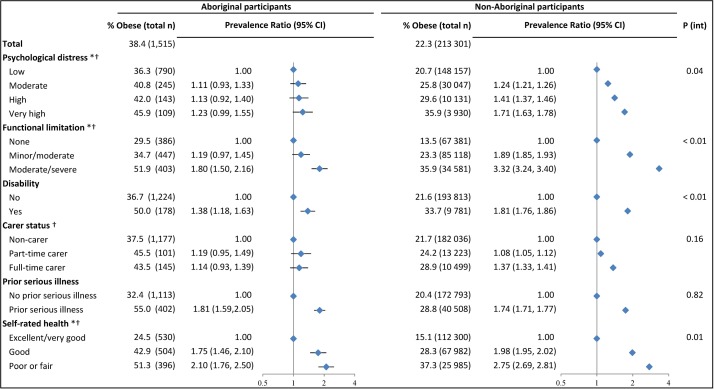
Figure 4.
Obesity prevalence and prevalence ratios among Aboriginal and non-Aboriginal participants according to health status factors. Total n=1515 Aboriginal participants and 213 301 non-Aboriginal participants across all models; a category for missing data was included for each exposure variable but these results are not presented. Prevalence ratios are adjusted for age ((in 5-year increments up to age <80 and ≥80 years) and sex, where appropriate. Horizontal lines represent 95% CIs around point estimates; the CIs in the non-Aboriginal sample are very narrow and are thus obscured by the marker for the point estimate. *Significant trend across categories among Aboriginal participants (only tested for ordinal variables). † Significant trend across categories among non-Aboriginal participants (only tested for ordinal variables).

