. 2018 Apr 23;9(20):4569–4578. doi: 10.1039/c8sc00286j

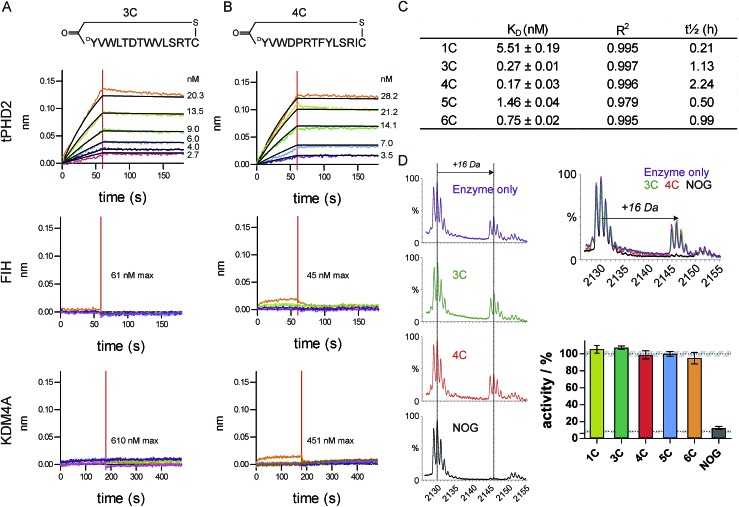
Fig. 2. Characterisation of CP hits. Biolayer interferometry traces for association and dissociation phases of binding for 3C (A) and 4C (B) to tPHD2 (top) and other representative 2OG-oxygenases (FIH (middle) and KDM4A (bottom)), with raw (coloured) and fitted (black) curves shown. (C) BLI KD values for CP binding to tPHD2, as determined by global fitting of the data with ± representing the standard error. Full traces for all peptides are in ESI Fig. 3. (D) MALDI-TOF MS based PHD2 inhibition assays with representative spectra (LHS) showing CODD hydroxylation (+16 Da peak). (RHS) Bar chart showing the normalised activity of tPHD2 (1 μM) relative to a DMSO control (average ± stdev n = 3). CPs were used at >4-fold excess of enzyme concentration. N-Oxalylglycine (NOG), a 2OG mimicking inhibitor of PHD2, is a positive inhibitor control (10 μM).

Fig. 2