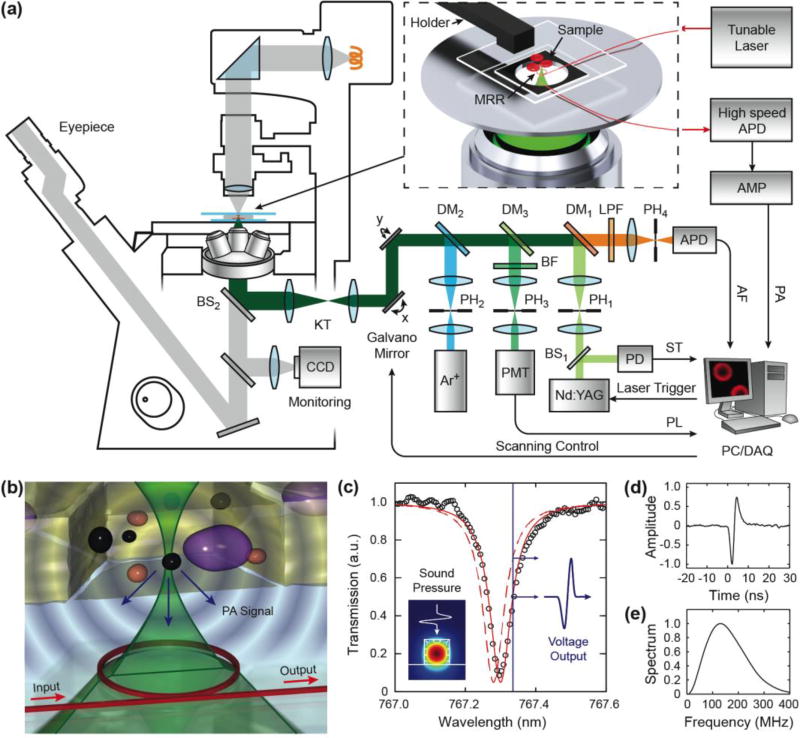
Fig. 1.
Schematic of the multimodality microscopy system. (a) An integrated microscopic system combining laser scanning confocal microscopy and PAM was realized by an optically transparent MRR ultrasonic detector. The inset illustrates a magnified view of the placement of the fiber coupled MRR ultrasonic detector and specimen. (b) Illustration of MRR detection of laser induced PA waves. (c) A representative transmission spectrum exhibits a pronounced resonance dip under the critical coupling condition (black circle) and its corresponding Lorenz fitting (red line). Inset is the numerical simulation of the electric field distribution, which shows the fundamental TM mode in the waveguide. Using a narrow-band laser source (blue line), the pressure induced resonance shift (dashed red line) can be measured as the amplitude modulation of the transmitted optical signal. (d) The time-resolved PA pulse signal measured by the MRR ultrasonic detector. (e) Its corresponding power spectrum shows an ultra-broadband frequency response.

