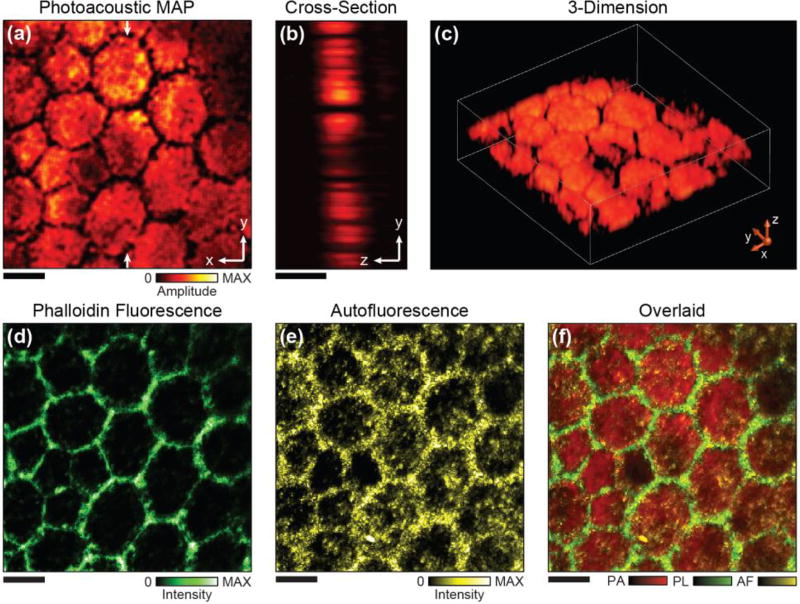
Fig. 3.
Simultaneous PAM and fluorescence confocal imaging of a human RPE flat mount. (a) Projection PAM image of the RPE along the x-y plane. (b) Cross-sectional PAM image along the x-z plane. (c) 3D visualization of the RPE cells imaged by PAM. (d) Actin stained confocal imaging highlights the boundaries of the RPE cells. (e) Autofluorescence confocal image shows the distribution of lipofuscin. (f) Overlaid image of all the three modalities acquired simultaneously. Scale bars: 10 µm.

