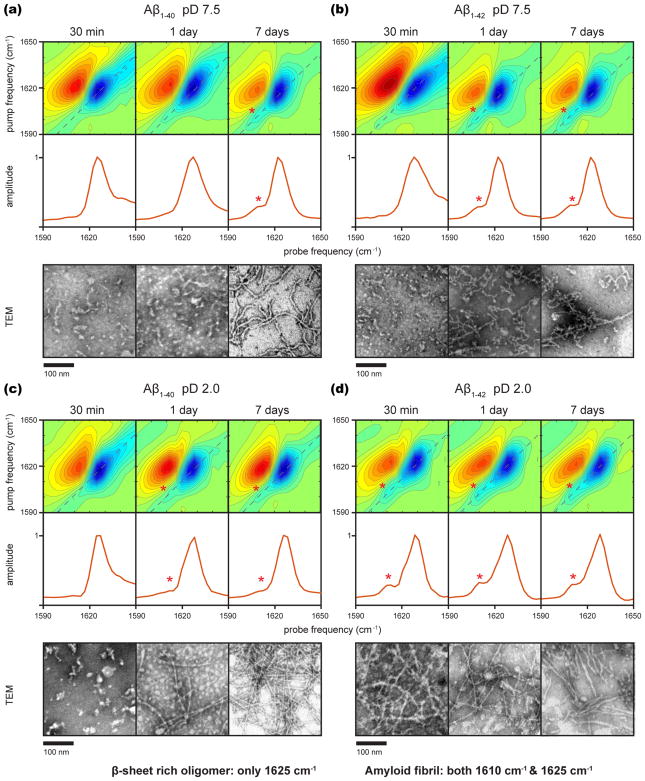
Figure 1.
Two-dimensional IR spectra of 1 mM Aβ aggregated for 30 min, 1 day, and 7 days, diagonal slices through the fundamental transition, and representative TEM images for the following samples: (a) Aβ1–40 in pD 7.5 20 mM Tris buffer, (b) Aβ1–42 in pD 7.5 20 mM Tris buffer, (c) Aβ1–40 in pD 2.0 0.04% NaN3 solution, and (d) Aβ1–42 in pD 2.0 0.04% NaN3 solution.

