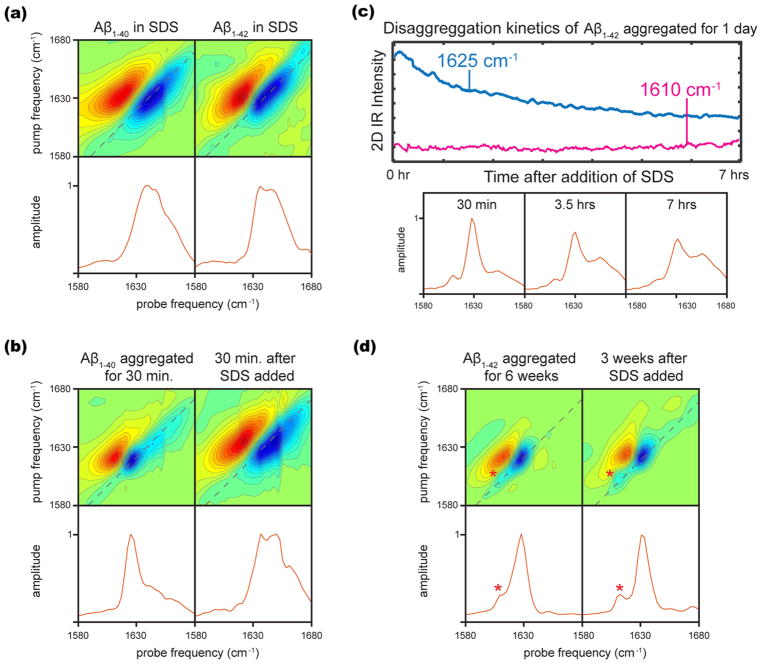
Figure 3.
(a) Two-dimensional IR spectra and diagonal slices of 1 mM Aβ1–40 and Aβ1–42 reconstituted directly into 100 mM SDS. (b) Two-dimensional IR spectra and diagonal slices of Aβ1–40 aggregated for 30 min in pD 7.5 Tris buffer and 30 min after the addition of an equal volume 100 mM SDS. (c) Kinetic traces from rapid scan 2D IR in the β-sheet and α-helical regions for Aβ1–42 aggregated for 1 day in pD 2.0 NaN3 solution, and diagonal slices at various disaggregation times scaled to the maximum intensity. (d) Two-dimensional IR spectra of Aβ1–42 aggregated for 6 weeks in pD 2.0 NaN3 solution and 3 weeks after the addition of an equal volume 100 mM SDS.

