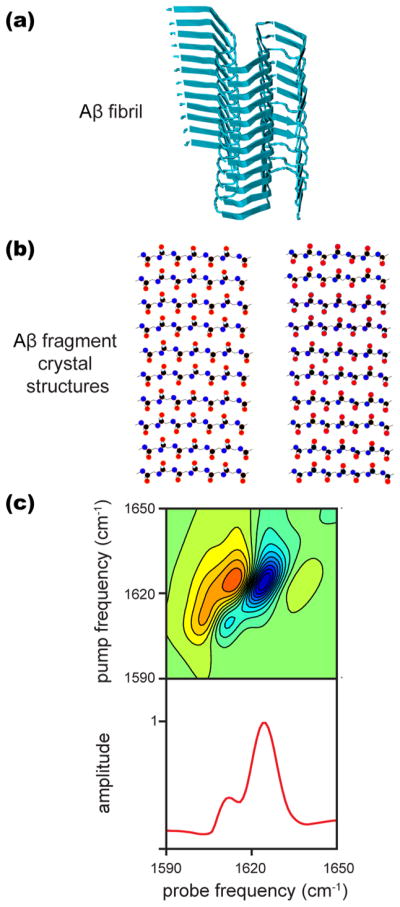
Figure 4.

(a) ssNMR structure of an Aβ fibril obtained from PDB structure 2mxu.73 (b) Atomic structures of Aβ35–42 fragments from PDB file 2y3k from which β-sheets were generated as described in the text. (c) The 2D IR spectrum simulated as a mixture of the two structures from panel (b) added in a 1:4 ratio to simulate the spectrum observed experimentally. Note that the local mode transition frequency was shifted to best match the experimental data, though the difference in frequency is unaffected by this shift. Details of the calculations are given in Materials and Methods section.
