
Figure 4.
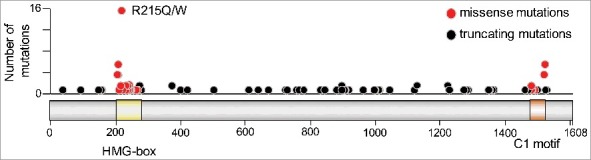
CIC mutations in CNS/brain tumors. Number of mutations are plotted along the length of the CIC-S protein (depicted with the HMG-box and C1 domains highlighted in yellow and brown, respectively). Missense mutations are indicated by red circles and truncating mutations by black circles. Mutation data were obtained from cBioPortal Version v1.8.3, selecting only CNS/brain datasets.