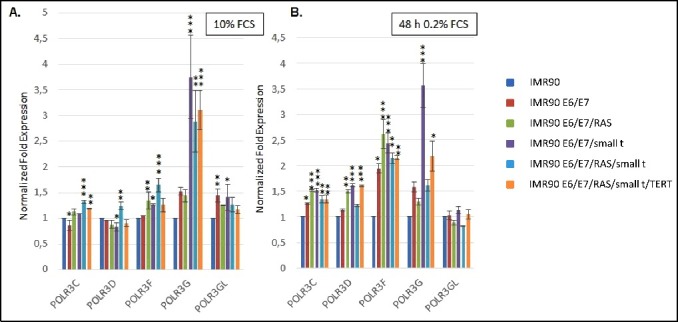
Figure 3.

RT-qPCR analyses of the expression of Pol III subunits. (A.) Expression of POLR3C, -D, -F, -G and GL in cells grown in the presence of 10% Fetal calf serum (FCS) (B.) Expression of POLR3C, -D, -F, -G and GL in cells grown in the presence of 0.2% FCS. The colour code of individual cell lines employed is depicted to the right. The genes analysed are appropriately indicated below the graphs. RT-qPCR data were normalized relative to expression in IMR90 cells and to the expression of PPIA and PMM1 genes that were determined as stable housekeeping genes in the transformation model system by employing the Bestkeeper software. Normalization of expression in cells grown in 10% FCS or 0.2% FCS is relative to IMR90 cells grown under the same conditions. Data were obtained from three independent experiments and standard deviation is shown. Statistically significant differences between the groups were determined by analysis of variance (ANOVA). p-values of Tukey's post-hoc analyses are presented. *P<0.05, **P<0.01 and ***P<0.001.
