
Figure 5.
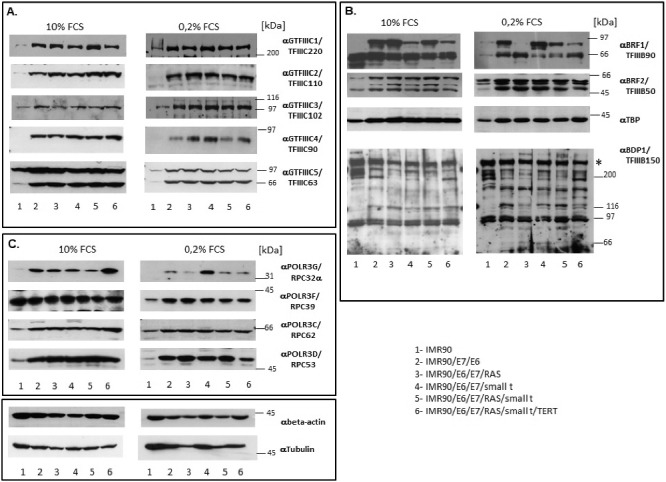
Western blot analyses of the expression of Pol III subunits and transcription factors. (A.) Analyses of subunits of TFIIIC. (B.) Analyses of subunits of TFIIIB. (C). Analyses of RNA polymerase III subunits. The numbers below the figures correspond to the cell lines listed in the table in the bottom right corner of the Figure. The proteins analysed are appropriately indicated to the right of individual images. Extracts derived from cells grown with 10% FCS or 0.2% FCS are respectively shown in left or right panels of each Figure.