
Figure 1.
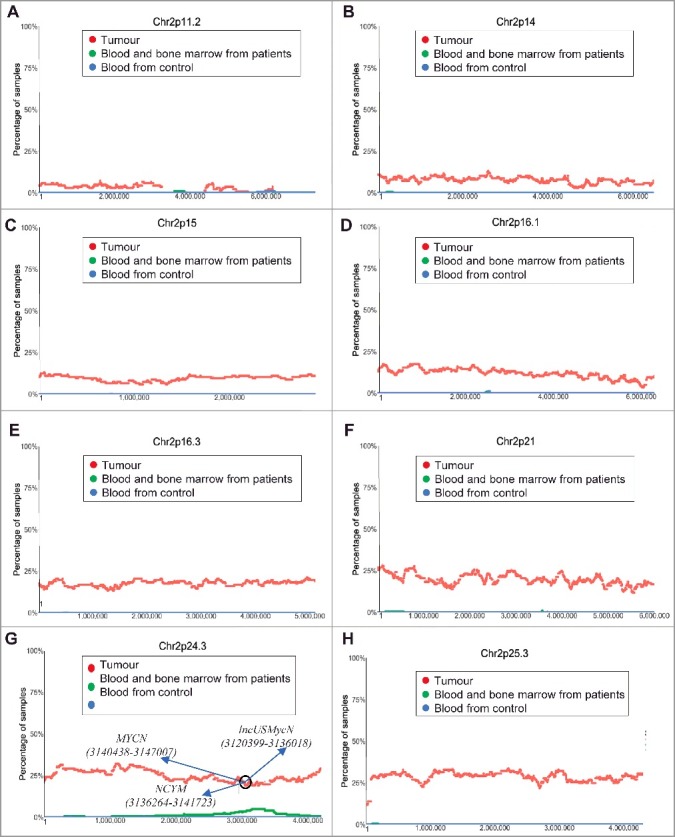
Chromosome 2p11.2-2p25.3 gain in human neuroblastoma tissues. SNP array data originally generated by the TARGET initiative (https://target-data.nci.nih.gov/) and the CHOP Copy Number Variance project were analysed. Chromosome amplification frequencies in neuroblastoma tissues, compared with blood and bone marrow samples from the neuroblastoma patients and blood samples from healthy children, at different regions of chromosome 2 were plotted against all genomic locations, including the following representative regions: Chr2p11.2 (A), Chr2p14 (B), Chr2p15 (C), Chr2p16.1 (D), Chr2p16.3 (E), Chr2p21 (F), Chr2p24.3 (G) and Chr2p25.3 (H). Tumour = tumour samples; Blood and bone marrow from patients = normal blood and bone marrow samples from neuroblastoma patients; Blood from control = blood samples from heathy children from The Children's Hospital of Philadelphia.