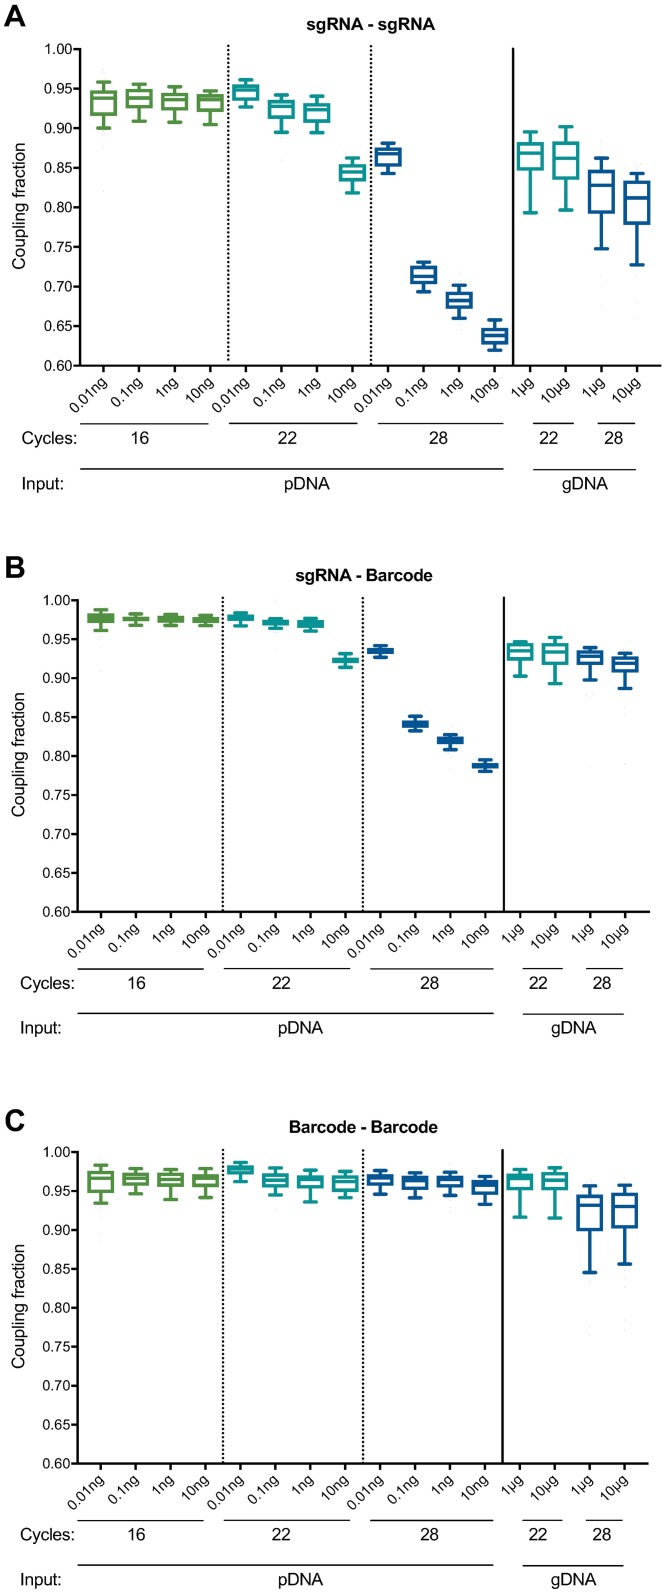
Fig 2. Comparison of uncoupling across sample types, input amounts, and number of PCR cycles.
(A) Uncoupling between SaCas9 sgRNAs and SpCas9 sgRNAs under various PCR conditions. Each box represents 57 paired sgRNAs, plotting the fraction of reads for which the sgRNAs were correctly paired. The line represents the median, the box the 25th and 75th percentiles, and the whiskers the 10th and 90th percentiles. Our initial PCR conditions (28 cycles with 10 ng pDNA and 10 μg gDNA) led to substantial uncoupling. (B) Uncoupling between sgRNAs and their associated barcodes under various PCR conditions. (C) Uncoupling between barcodes under various PCR conditions. Box and whisker plots in (B) and (C) are the same as in (A).

