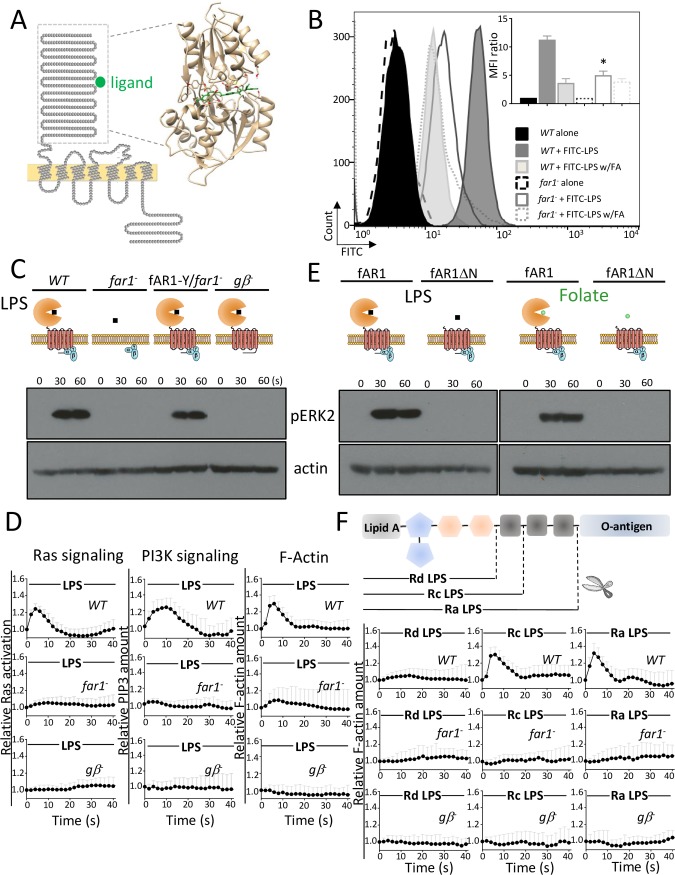
Fig 1. LPS triggered chemotactic signaling through fAR1.
(A) fAR1 possesses a VFT domain for ligand binding. The sequence and topology of fAR1 is shown on the left. The extracellular domain of fAR1 was highlighted by a dashed box. On the right, structural modeling and computational docking predict that the extracellular domain of fAR1 folds into a VFT structure functioning as the binding site for FA moiety (green). (B) far1− has decreased LPS-binding ability. The LPS binding was determined in flow cytometry by measuring the fluorescent intensity of cells binding to FITC-LPS on the surface. The representative data is shown. The MFI ratio with SD from 3 independent repetitions, which reflects the LPS binding of WT and far1− cells in the presence or absence of FA, were graphed. A Student t test indicated a statistically significant difference in LPS binding between far1− and WT cells (* indicates P < 0.01). (C) ERK2 signaling triggered by LPS is impaired in far1− and gβ− cells. ERK2 activation in vegetative WT, far1−, gβ−, and fAR1-Y/far1− cells in response to 100 μg/ml LPS stimulation was examined. ERK2 activation was determined by immunoblotting with anti–phospho-ERK2 antibody, using actin as a loading control. (D) LPS-induced Ras activation, PIP3 signaling, and actin polymerization are mainly dependent on fAR1 and Gβ. Vegetative WT and mutant cells expressing RBD-GFP, PHCRAC-GFP, and LimEΔcoil-GFP were stimulated with 100 μg/ml LPS at 0 s. The transient increase in fluorescence intensity was measured at the plasma membrane and graphed. The intensity of the GFP signal was normalized to the first frame of each set of cells. Mean and SD from 10 cells are shown for the time course. A Student t test indicated a statistically significant difference in fluorescence intensity peak value between far1−, gβ−, and WT cells (P < 0.01). (E) VFT domain of fAR1 is essential for ERK2 activation by LPS and FA. ERK2 activation in vegetative fAR1-Y/far1− and fAR1ΔN-Y/far1− cells in response to 100 μg/ml LPS or 100 μM FA stimulation was examined by immunoblotting with anti–phospho-ERK2 antibody, using actin as a loading control. (F) fAR1 recognizes saccharide region in LPS to transduce signal. Schematic structure of bacterial LPS molecule, which contains lipid A, core region, and O-antigen. Mutant LPS molecules are composed of same lipid A but different saccharides in core region. Vegetative WT, far1−, and gβ− cells expressing LimEΔcoil-GFP were stimulated with 100 μg/ml different LPS at 0 s. The transient increase in fluorescence intensity was measured at the plasma membrane and graphed. The intensity of the GFP signal was normalized to the first frame of each set of cells. Mean and SD from 10 cells are shown for the time course. A Student t test indicated a statistically significant difference in fluorescence intensity peak value between far1−, gβ−, and WT cells triggered by Ra- and Rc-LPS (P < 0.01). There is no significant difference in fluorescence intensity peak value between mutants and WT cells triggered by Rd-LPS under the test condition. Underlying data can be found in S1 Data. ERK2, extracellular signal-regulated kinase 2; FITC, fluorescein isothiocyanate; FA, folic acid; fAR1, folic acid receptor 1; GFP, green fluorescent protein; LimEΔcoil, partial sequences of LimE protein; LPS, lipopolysaccharide; MFI, mean fluorescence intensity; PHCRAC, PH domain of cytosolic regulator of adenylyl cyclase; PIP3, phosphatidylinositol (3,4,5)-trisphosphate; RBD, Ras binding domain; VFT, Venus-Flytrap; WT, wild-type.

