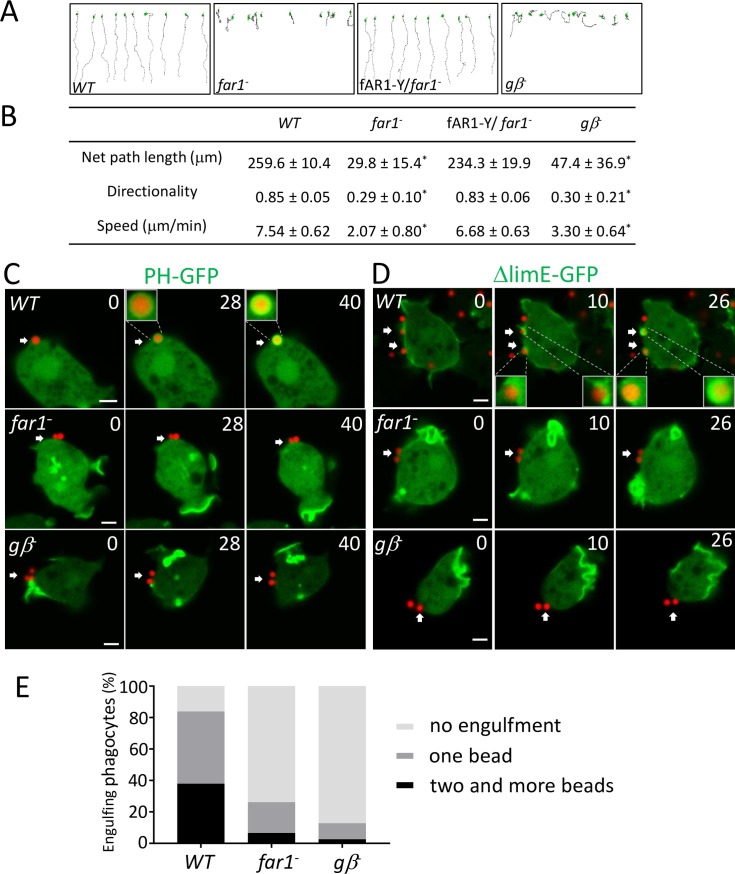
Fig 3. fAR1/G protein machinery mediates LPS-induced cell migration and particle engulfment.
(A) EZ-TAXIScan chemotaxis toward a linear LPS gradient of vegetative WT, gβ−, far1−, and fAR1-Y/far1− cells. Migration paths toward LPS are shown. (B) Ten cells of each strain from (A) were used for tracing. The mean and SD resulting from quantification of chemotaxis parameters are shown. A Student t test indicated a statistically significant difference between gβ−, far1−, and WT cells (* indicates P < 0.01). (C) LPS on particle surface triggers localized PIP3 signaling and engulfment. Engulfment of 1 μm LPS-coated beads (red) by WT but not far1− or gβ− cells expressing PHCRAC-GFP (green). Scale bar: 2 μm. (D) LPS on particle surface triggers localized actin polymerization to form phagocytic cup. Engulfment of 1 μm LPS-coated beads (red) by WT but not far1− or gβ− cells expressing LimEΔcoil-GFP (green). Scale bar: 2 μm. (E) LPS triggers engulfment through fAR1 and Gβ. Quantitation of engulfment movies from C and D to compare engulfment ability between WT, far1−, and gβ− cells. A Student t test indicated a statistically significant difference in percentage of cell-engulfing LPS-beads between far1−, gβ−, and WT cells (P < 0.01). Underlying data can be found in S1 Data. fAR1, folic acid receptor 1; LimEΔcoil, partial sequences of LimE protein; LPS, lipopolysaccharide; PHCRAC, PH domain of cytosolic regulator of adenylyl cyclase; PIP3, phosphatidylinositol (3,4,5)-trisphosphate; WT, wild-type; LimEΔcoil, partial sequences of LimE protein

