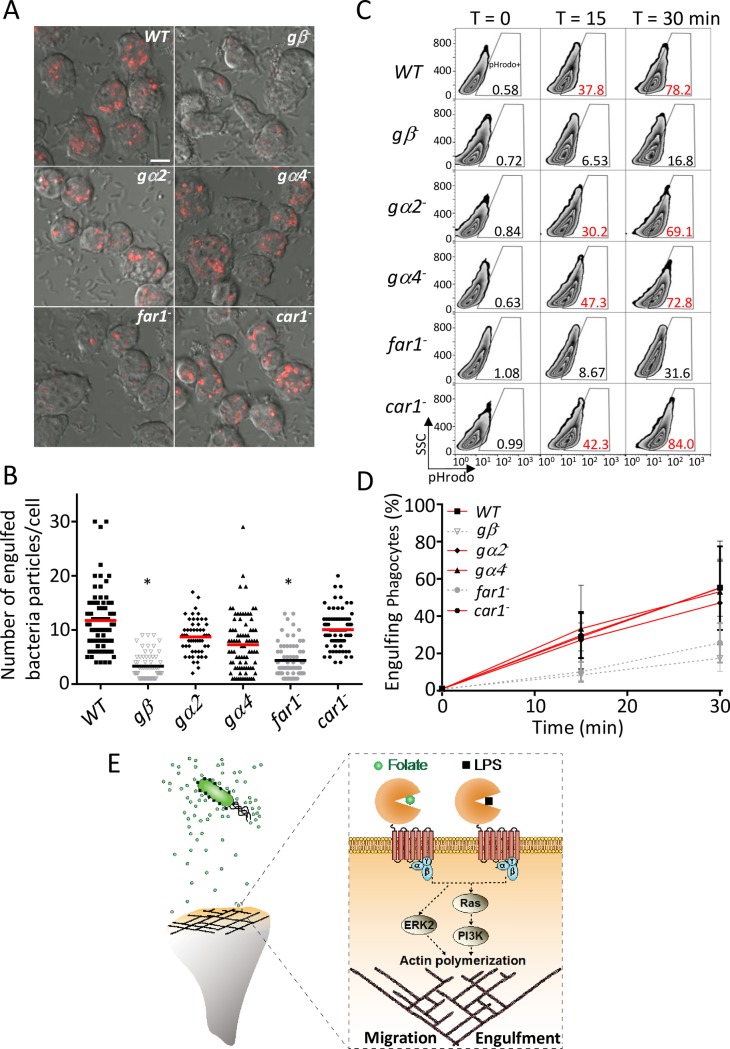
Fig 4. fAR1/G protein machinery mediates live K. aerogenes engulfment.
(A) WT and mutants were mixed with pHrodo-labeled K. aerogenes at a 1:50 ratio. After 20 min, cells were mounted on a slide in basic pH buffer and analyzed by confocal microscopy. The representative data are shown. The engulfed pHrodo-labeled K. aerogenes are shown as red; Scale bars, 5 μm. (B) The engulfed bacterial number in each cell from (A) was measured and plotted for WT and mutant cells. A Student t test indicated a statistically significant difference in number of engulfed bacteria per cell between far1−, gβ−, and WT cells (* indicates P < 0.01). (C) WT and mutant cells were mixed with pHrodo-labeled live K. aerogenes at a 1:100 ratio for the indicated time. Cells were suspended in basic pH buffer and analyzed for the percentage of pHrodo positive cells by flow cytometry, which represents the cells that engulfed K. aerogenes. Quantification of engulfed K. aerogenes is compared between different Dictyostelium strains. (D) The mean and SD resulting from quantification of 3 independent repetitions of the experiments exemplified in (C) are plotted. (E) fAR1 recognizes not only diffusible chemoattractant but also immobilized ligand on bacterial surface to mediate both migration and engulfment. Underlying data can be found in S1 Data. ERK2, extracellular signal-regulated kinase 2; fAR1, folic acid receptor 1; LPS, lipopolysaccharide; PI3K, phosphatidylinositol-4,5-bisphosphate 3-kinase abbreviation SSC, side scatter; WT, wild type.

