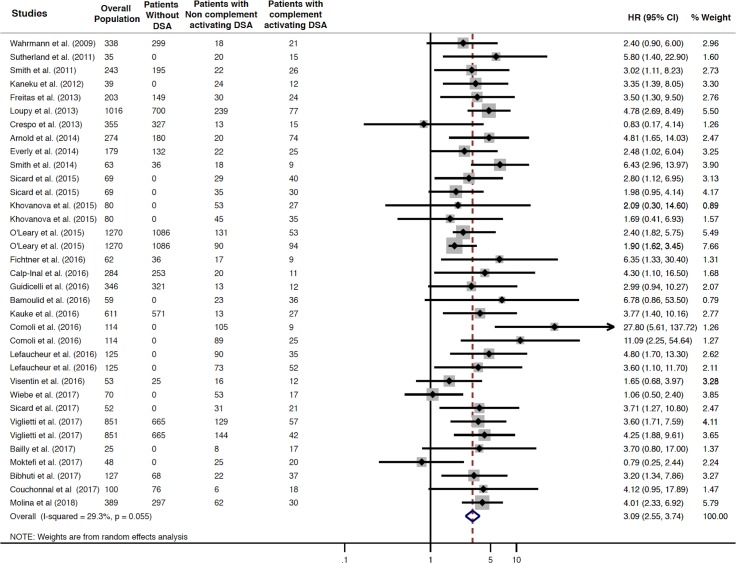
Fig 3. Association between circulating complement-activating anti-HLA DSAs and the risk of allograft loss.
Fig 3 shows the forest plot of the association between complement-activating anti-HLA DSAs and the risk of allograft loss for each study and overall (n = 29). Studies are listed by date of publication. Number of patients are listed in the 3 cohort columns. The black diamond-shaped boxes represent the HR for each individual study. The grey boxes around the black diamond represent the weight of the study, and lines represent the 95% CI for individual studies. The blue diamond at the end represents the pooled HR. The number of patients in the overall population does not correspond to the sum of the different groups for the studies of Kaneku et al. (2012) (3 patients), Sicard et al. (2015) (4 patients), and Moktefi et al. (2017) (3 patients) either because the data for these patients were missing or because they were not involved in the analysis. CI, confidence interval; DSA, donor-specific antibody; HLA, human leukocyte antigen; HR, hazard ratio.

