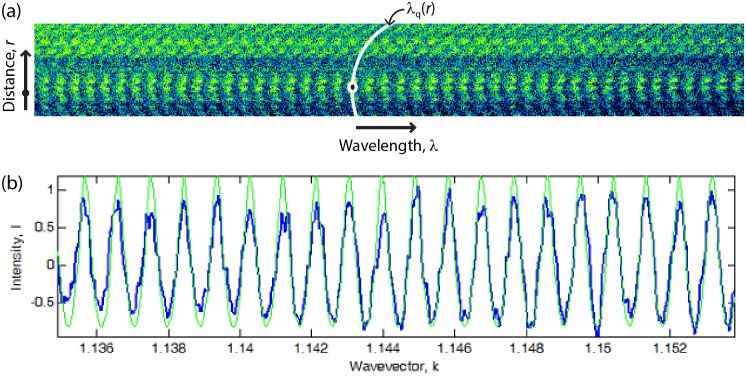
Fig 2. Multiple-beam optical interferometry.
(A) Spectrograph showing the light transmitted through a cornea sample as function of the wavelength λ and distance r from the point of closest approach (black dot) between the surfaces. Each curved fringe is a FECO with different chromatic order q (e.g., white curve λq(r)). The curvature along the direction r reflects the surface curvature. (B) Comparison between the measured transmitted spectrum at the contact position (blue) and the spectrum calculated from Eq 2 (green).

