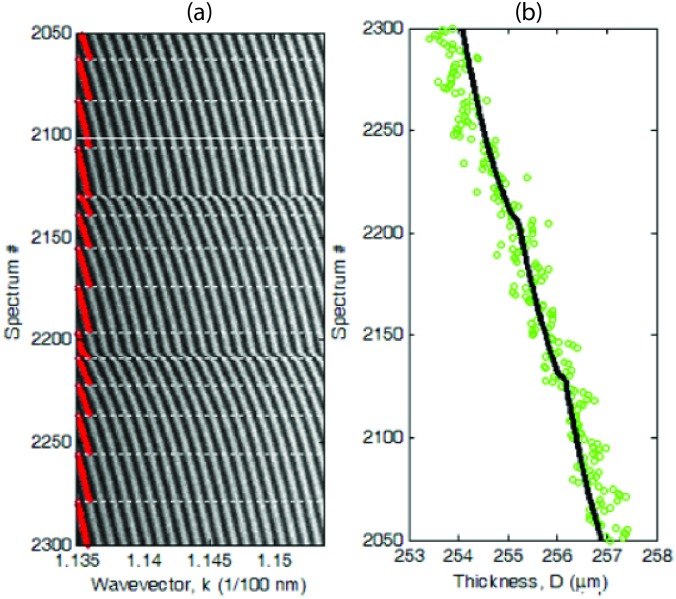
Fig 3. Time-resolved optical measurement of corneal sample thickness.
(A) Spectrogram of light transmitted through a corneal sample at the contact point during step-wise surface approach (compression). Each line of the image shows the intensity spectrum recorded at a given time, with a constant rate of 2 spectra/s. Dashed horizontal lines mark the times when a new peak with wavevector k1 (red dots) entered the spectral range, increasing the chromatic order of the first peak from q1 to q1+1. The white solid line corresponds to the FECOs and spectrum of Fig 2. (B) Surface separation distance D determined for each spectrum by Fourier analysis (green circles) or by a lock-in computational procedure that tracks the position and order of the first peak (black line).

