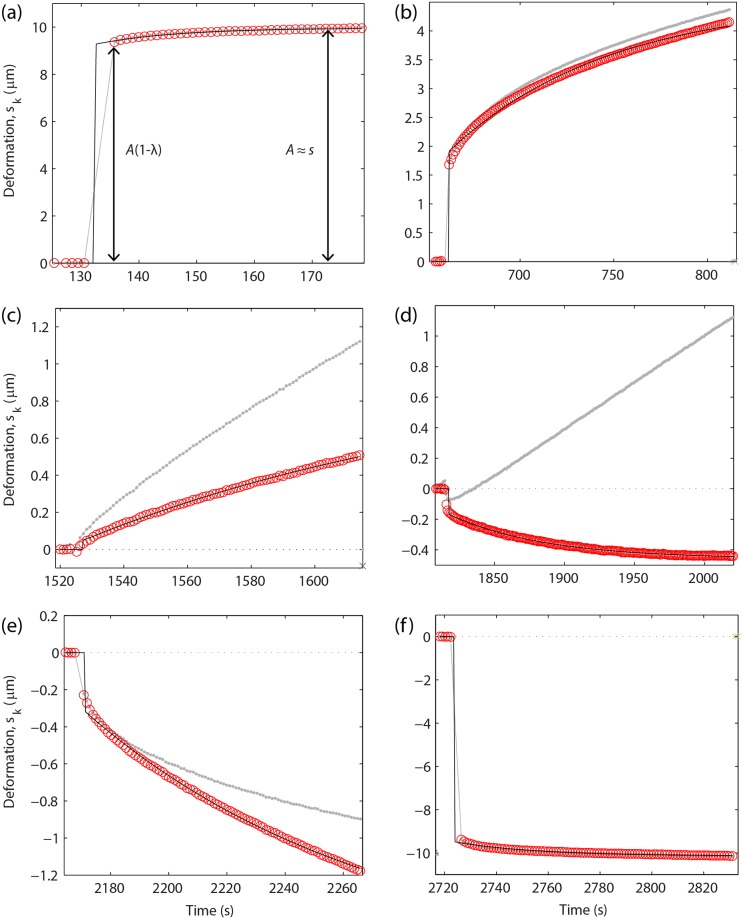
Fig 5. Cumulative exponential fit of the transient viscous response.
Gray dots show the relative surface displacement sk = D − Dk measured after applying k displacement steps with amplitude s = 10 μm to the SFA cantilever. When both surfaces were in contact with the sample, D and sk were respectively the sample thickness and relative deformation after applying k steps. The relative displacement caused only by the last kth step (red circles) was obtained after subtracting the cumulative response of the previous k − 1 steps (Eq 4) and was fitted with a single exponential (solid line). (A) Surface approach before contact. (B, C) Increasing compression. (D) First step of surface retraction/decompression. (E) Surface detachment. (F) Retraction after detachment.

