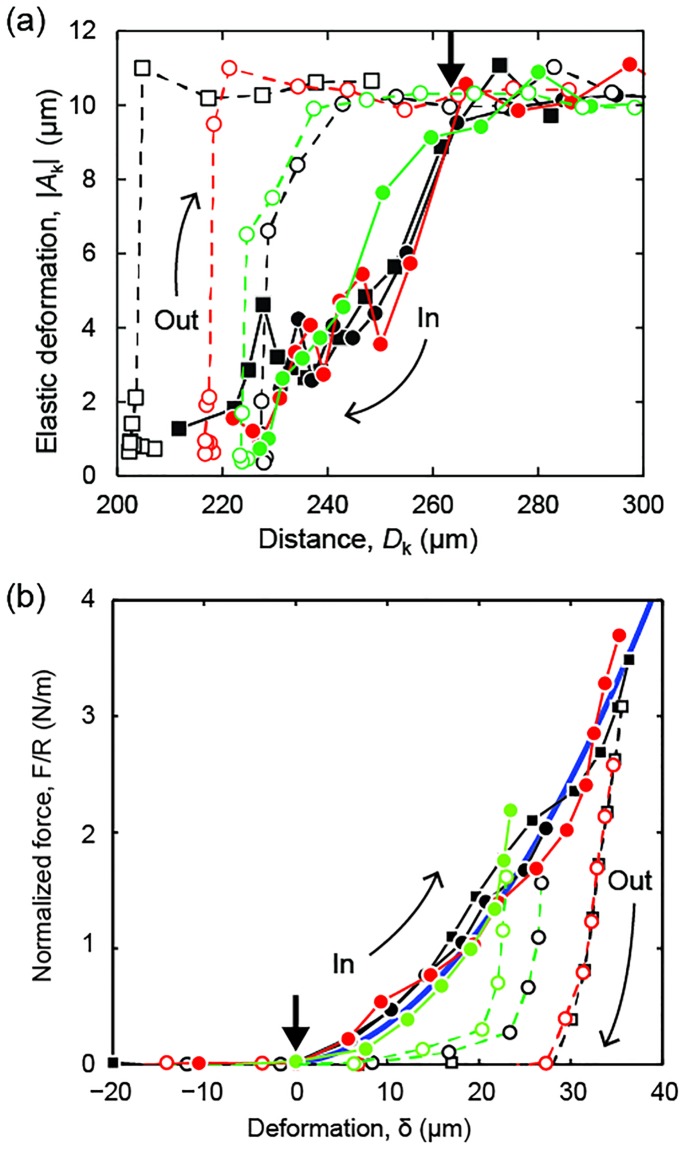
Fig 6. Equilibrium response.
(A) Amplitude Ak of the elastic deformation in response to the last step of a series of k cantilever displacements. Dk was the surface separation distance when the last step was applied. (B) Elastic force F normalized by the curvature radius R as a function of the total equilibrium deformation δ. The data and symbols are the same as above. The thick solid line is a model curve F/R = πEδ2/D0 with E = 0.2 MPa. Filled and open symbols indicate surface approach (in) and retraction (out), respectively. Squares/circles indicate different contact positions. Different colors indicate different measurements. The bold arrow indicates the undeformed thickness D0 = (265 ± 10) μm.

