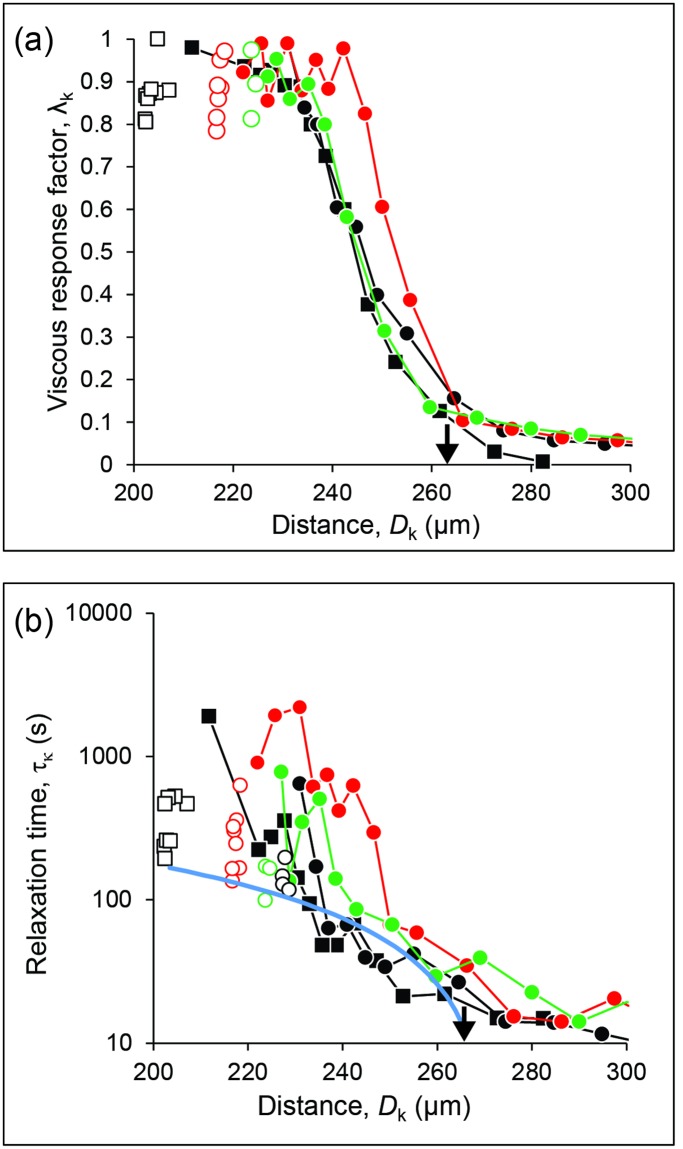
Fig 7. Viscoelastic response.
(A) Variation of the viscous response factor λk to changes of surface distance Dk. (B) Variation of the relaxation time τk. The solid line is the curve τ = cδ with c = 2.35×10⁶ s/m. The data and symbols are the same as in Fig 6. Data obtained after surface detachment have been omitted for clarity.

