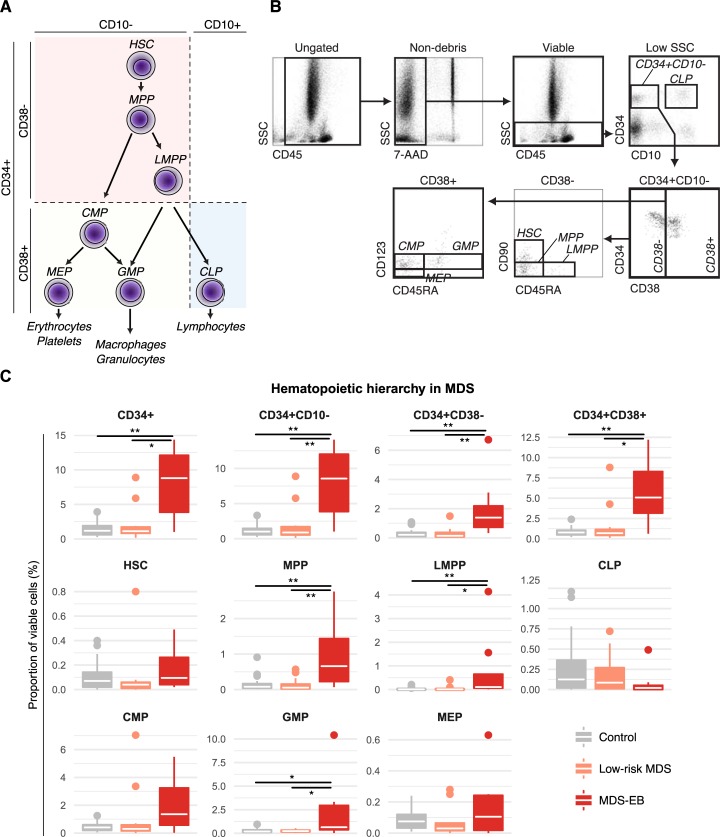
Fig 1. Dissection of all major hematopoietic stem and progenitor cell (HSPC) compartments in MDS reveals expansion of MPP, LMPP, CMP, and GMP compartments in MDS with excess blasts (MDS-EB).
(a) Schematic representation of major HSPC populations identified by the employed gating strategy. (b) Representative example of gating hierarchy. (c) Proportions of HSPC compartments in control versus MDS patients expressed as percent of viable bone marrow cells. White crossbars represent the median and boxplots hinges represent the first and third quartiles. *p<0.05, **p<0.01; CLP, common lymphoid progenitor cells; CMP, common myeloid progenitor cells; GMP, granulocyte macrophage progenitor cells; HSC, uncommitted hematopoietic stem cell; LMPP, lymphoid-primed multipotent progenitor cells; MEP, megakaryocytic erythroid progenitor cells; MPP, multipotent progenitor cells.

