
Figure 6.
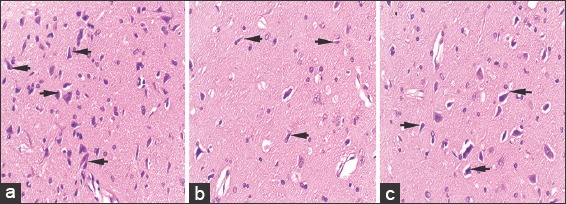
Hematoxylin and eosin stained, 5 μ thick sections of striatum at ×40 in control (a), rotenone (b), and chrysin+rotenone (c) treated animals. Sections c is showing a higher number of neurons with uniform dimensions as compared the neurons in section b from rotenone-treated animals