
Fig. 1. NRP2b is differentially induced by TGFβ.
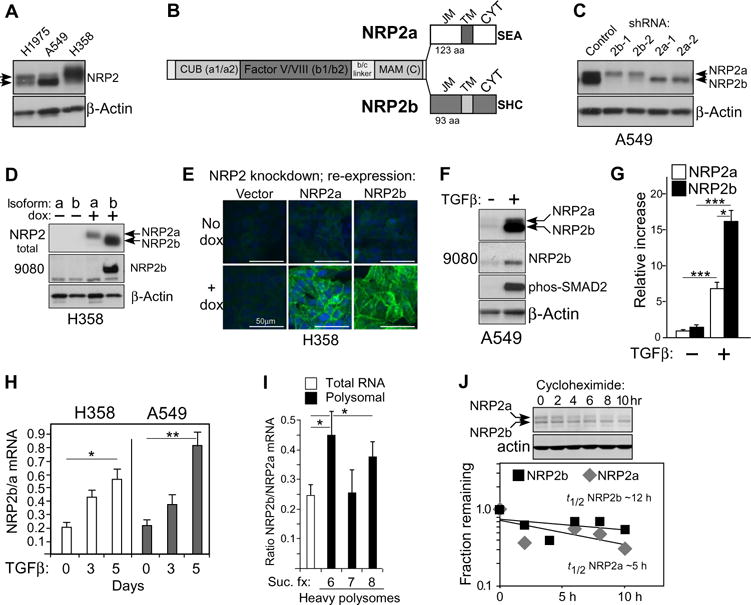
(A) Western blot of cell lysates from indicated NSCLC cell lines probed for NRP2 and actin; arrowheads indicate double band. A549 cells were pretreated with TGFβ for 24 hours. (B) Diagram of NRP2a and NRP2b isoforms indicating shared extracellular domains [CUB (a1/a2), Factor V/VIII (b1/b2), and MAM (c)] and C-terminal sequences comprising the juxtamembrane (JM), transmembrane (TM), and cytoplasmic (CYT) domains. Three C-terminal amino acids of each isoform are indicated. (C) A549 cells stably transfected with isoform-specific shRNAs were analyzed by Western blot for NRP2; actin confirmed equal loading. Bands corresponding to NRP2a and NRP2b are indicated. (D) H358 cells expressing dox-inducible shRNA-resistant isoforms were analyzed by Western blot for total NRP2 and for NRP2b using the b-specific antibody 9080. (E) Confocal immunofluorescence microscopy of H358 cells expressing dox-inducible NRP2 isoforms. Fixed cells were stained with an antibody recognizing NRP2 (green); nuclei were counterstained with 4′,6-diamidino-2-phenylindole (DAPI, blue). Scale bars, 50 μm. (F) Western blot of A549 cells treated with TGFβ (5 ng/ml; 24 hours) using indicated antibodies. (G) Quantitation of isoform-specific bands from (F). Densitometric values were processed by ImageJ and normalized to the control NRP2a band. Data are means ± SEM from n = 4 experiments; *P ≤ 0.05, ***P ≤ 0.001, one- or two-sample t tests on a log scale. (H) Quantitative RT-PCR for NRP2 isoforms in the indicated cell lines after a time course of TGFβ exposure. The NRP2b/NRP2a ratio is plotted versus time. Data are means ± SEM from n = 3 experiments; *P ≤ 0.05, **P ≤ 0.01, two-sample t test analyzed on a log scale. (I) Quantitative RT-PCR for NRP2b/NRP2a ratio in total and polyribosome-bound RNA from sucrose gradient fractions (Suc. fx.) from H358 cells after 24 hours of TGFβ exposure. Data are means ± SEM from n = 3 experiments; *P ≤ 0.05, two-tailed t test analyzed on a log scale. (J) Reanalysis of a previously published Western blot for A549 cells after 24 hours TGFβ ± cycloheximide (17). Top: Cycloheximide decay time course. Bottom: Densitometric analysis of NRP2a (top) and NRP2b (bottom) bands, plotted separately. The fractions remaining were used to calculate the approximate t1/2 for each isoform.