
Fig. 2. Effects of NRP2 isoforms on migration and invasion.
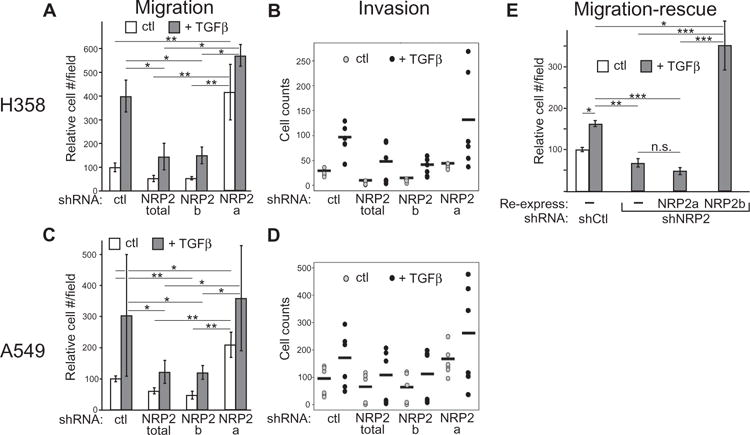
(A to D) Transwell migration (A and C) and invasion (B and D) for H358 (A and B) and A549 (C and D) cells in response to TGFβ. Cells bearing indicated knockdowns were compared over 24 (A) or 18 (C) hours. Data in (A) and (C) are means ± SEM from n = 3 experiments; *P ≤ 0.05, **P ≤ 0.01, linear combinations of analysis of variance (ANOVA) parameters analyzed on a log scale. Data in (B) and (D) are dot plots (n = 2; horizontal bars represent the mean). (E) Migration-rescue assay in H358 cells bearing the indicated knockdowns, with or without reexpressed shRNA-resistant isoforms, treated with dox and placed into Boyden chambers. Cells that migrated after 24-hour exposure to TGFβ were counted. Data are means ± SEM from n = 3 experiments; *P ≤ 0.05; **P ≤ 0.01; ***P ≤ 0.001, linear combinations of ANOVA parameters analyzed on a log scale. n.s., not significant.