
Fig. 5. NRP2b abundance is associated with acquired EGFR inhibitor resistance.
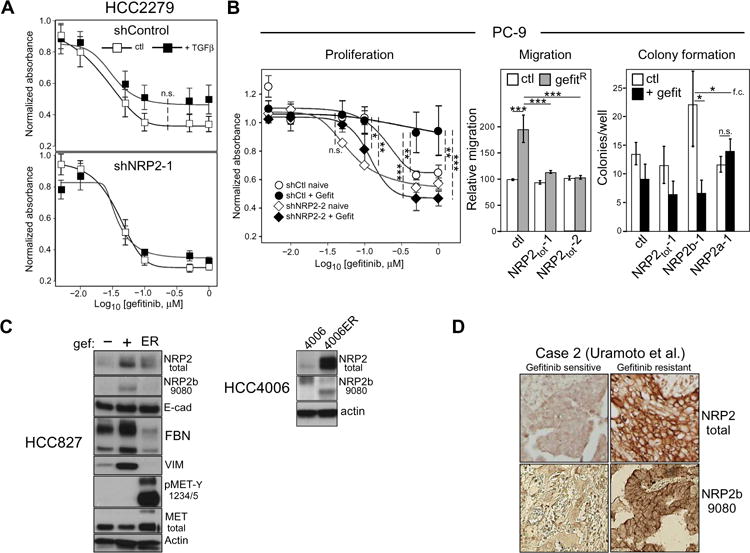
(A) Gefitinib senstivity of HCC2279 cells, without and with NRP2 knockdown, was assessed by MTS proliferation assay in the presence or absence of TGFβ (n = 5 experiments). A trend to increased resistance was observed in TGFβ-exposed control cells, but not when NRP2 was knocked down. n.s., not significant. (B) Left: Proliferation assay of shControl and shNRP2 PC-9 cells, cultured in the presence (+Gefit) or absence (naïve) of 50 nM of gefitinib for 4 weeks. n = 4 experiments; two-way ANOVA. Middle: Transwell migration assays of gefitinib-exposed PC-9 cells bearing the indicated knockdowns. n = 3 experiments; linear combinations of ANOVA parameters analyzed on a log scale. Right: Clonogenic colony formation assay of gefitinib-exposed PC-9 cells bearing the indicated knockdowns performed in the absence or presence of 50 nM of gefitinib. n = 3 experiments; linear combinations of ANOVA parameters analyzed on a log scale; f.c., fold change. *P ≤ 0.05; **P ≤ 0.01; *** P ≤ 0.001. (C) Left: HCC827 cells selected in gefitinib (+) or not (−) were analyzed by Western blot with the indicated antibodies. Erlotinib-resistant HCC827-ER cells (ER) are included for comparison. Right: HCC4006 and erlotinib-resistant HCC4006-ER cells were analyzed for NRP2 and NRP2b. Blots are representative of at least three independent experiments. (D) Staining for total NRP2 and NRP2b (9080) in patient biopsies from an EGFR mutant tumor, before and after development of gefitinib resistance [n = 3; shown is case #2; Uramoto et al. (29)].