
Fig. 2. SAXS shape reconstruction, trial gold label positions, and computed scattering intensity profiles.
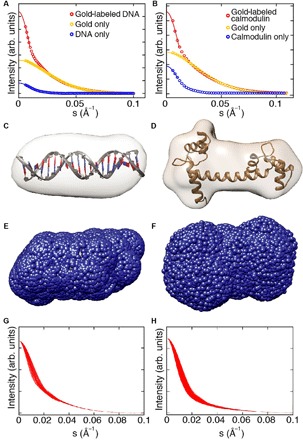
(A and B) SAXS profiles and Guinier fits for representative samples [20-bp end-labeled DNA in (A) and calmodulin labeled at position N111C in (B)]. Experimental SAXS profiles are shown as circles and the number of s-bins is reduced for clarity. Guinier fits to determine I(0) are shown as solid lines. (C and D) 3D reconstructions of 20-bp DNA in (C) and calmodulin in (D). The known high-resolution structures are superimposed (27). (E and F) Trial gold label positions (blue spheres) calculated around the envelope of the 3D reconstruction for the 20-bp DNA (E) and calmodulin (F). (G and H) Calculated total intensity profiles for a reduced set of trial gold label positions for 20-bp DNA (G) and calmodulin (H). All trial profiles were ordered from the best to the worst fitting, and every 20th curve is shown for clarity, resulting in 91 traces for 20-bp DNA (G) and 1200 traces for calmodulin (H).