
Fig. 3. Determination of gold label positions for end-labeled DNA.
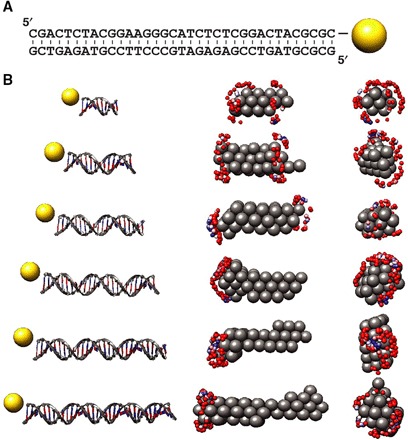
(A) Secondary structure of the 35-bp DNA duplex and the gold label position indicated on the 3′ end of the upper strand. (B) Mapping gold label positions to 3D reconstructions using SAXS data for end-labeled DNA. Left column: Schematic representations of the 10-, 15-, 20-, 25-, 30-, and 35-bp DNA constructs end-labeled with gold nanocrystals used in the study. Middle and right columns: Side (middle) and front (right) views of the 3D reconstructions of the unlabeled samples (shown as gray spheres) and mapped positions of the gold labels (blue to red spheres; blue spheres correspond to the best fit). The placement of the gold labels at the end and off-center is reproduced well.